Single-asset historical research · By CoinNudge Research · · Guide updated 2026-10-04 · 22 min read
Is SUI crypto worth researching now? Price, supply and risk evidence
Is SUI crypto worth buying? Its native-network role is real, but that alone does not price the token. In 37 matched 90-day SUI/BTC historical starts, SUI's median return was −18.58% versus BTC's +4.92%; it beat BTC in 10/37 and had a deeper daily-open drawdown in all 37. The expanded 30/180/365-day check does not erase the risk: at 365 days SUI's median was +19.17% versus BTC's +55.57% across 28 completed starts, although SUI beat BTC in 13 of them. A September 2024 SUI start gained +337.82%, so 'never outperforms' is also false. Verify present supply, network use and loss tolerance; this is not a live buy/sell verdict.
Download all 37 paired starts · Review SUI supply method
What does SUI's price history actually say about buying it?
- The 37-start 90-day median favored BTC; six starts had a positive SUI return but still lagged BTC. All 37 paired paths are visible below, and extreme positive SUI exceptions still occurred.
- SUI pays Sui gas and can be staked under the network design; that confirms a token role, not future token demand or a fair entry price.
- At the September 26 provider snapshot, roughly 40.97% of maximum SUI supply was reported circulating. The uncirculated remainder is not a single upcoming unlock or guaranteed sell pressure.
Did SUI beat Bitcoin after 90 days in the matched historical sample?
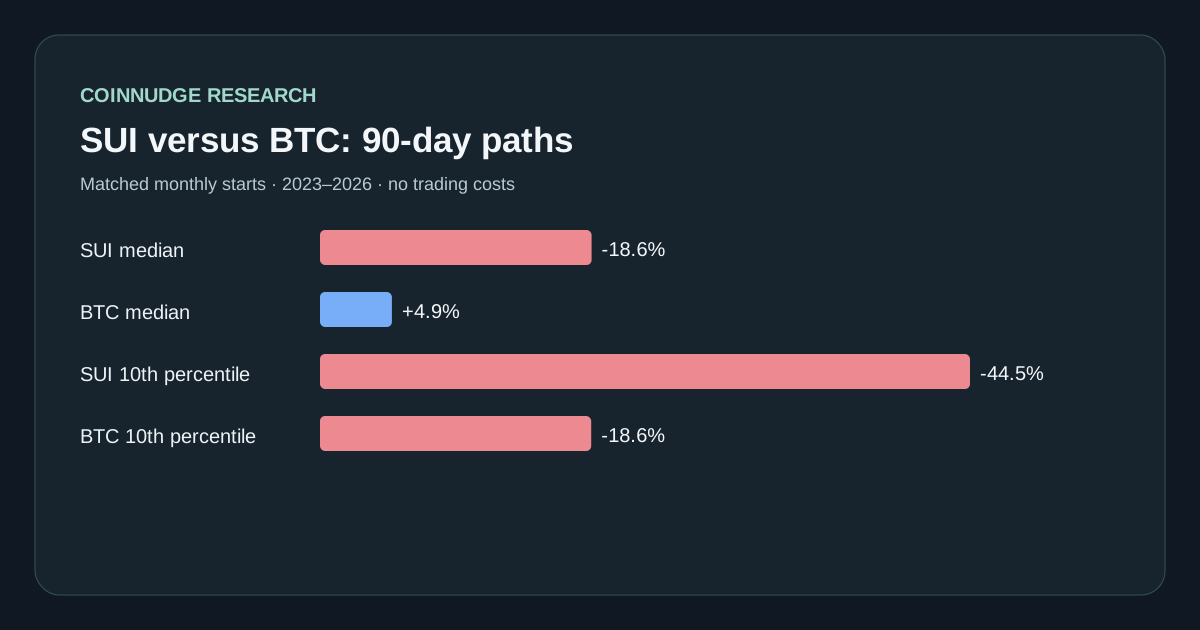
In the 37 paired starts, SUI's median 90-day return was −18.58% and BTC's +4.92%. SUI was positive in 16/37 paths while BTC was positive in 22/37; SUI beat BTC in 10/37. The SUI 10th-percentile result was −44.47%, versus BTC's −18.55%. Each start buys at the same UTC daily open and exits 90 days later, so the comparison does not confuse a favorable SUI month with a different BTC month.
The comparison is not one-sided: SUI's 90th-percentile return was +151.62%, above BTC's +51.22%. A September 1, 2024 start ended +337.82% for SUI versus +65.26% BTC. A person selecting that win after it happened would miss the broader median, lower tail and interim drawdown. The history supports 'highly variable exposure,' not 'always buy' or 'never buy.'
| Matched 90-day metric | SUI/USDT | BTC/USDT | How to read it |
|---|---|---|---|
| Complete monthly starts | 37 | 37 | Same dates, June 2023–June 2026 |
| Median return | −18.58% | +4.92% | Typical sampled terminal outcome |
| 10th-percentile return | −44.47% | −18.55% | Lower-tail path end |
| 90th-percentile return | +151.62% | +51.22% | Upper-tail counterexample |
| Positive paths | 16/37 | 22/37 | Overlapping, not independent odds |
| SUI beats BTC | 10/37 | — | Paired return comparison |
Verify: 37-start SUI/BTC observation CSV · Full groups and method JSON
Does SUI beat Bitcoin if you hold for 30, 180 or 365 days instead?
We kept the same monthly SUI/BTC start list and matched Binance USDT daily opens, then tested 30, 90, 180 and 365 days. Thirty- and 90-day windows have 37 complete starts; 180 days has 34 and 365 days has 28. An immature longer window stays in the public candidate ledger and contributes no zero return. These windows are nested and overlap, so the rows are descriptive sensitivity checks, not independent evidence that a future SUI purchase has a particular success probability.
The median SUI return was −4.43% after 30 days, −18.58% after 90 days, −3.32% after 180 days and +19.17% after 365 days. BTC's matched medians were +2.44%, +4.92%, +25.84% and +55.57%. The 365-day SUI result is positive in absolute terms but still behind BTC's median; interpreting only its positive sign would obscure opportunity cost. SUI beat BTC in 11/37, 10/37, 11/34 and 13/28 starts at the respective horizons.
Path risk did not vanish with time. SUI had the deeper daily-open peak-to-trough drawdown in 36/37 complete 30-day pairs, all 37 90-day pairs, all 34 180-day pairs and all 28 365-day pairs. That does not mean BTC is risk-free: its own paths also declined. It means SUI's upside counterexamples came with materially different historical interim risk. A reader who could not stay invested through those declines could not assume the day-365 endpoint was attainable.
| Holding period | Matched starts | SUI median | BTC median | SUI beat BTC | SUI deeper drawdown |
|---|---|---|---|---|---|
| 30 days | 37 | −4.43% | +2.44% | 11/37 | 36/37 |
| 90 days | 37 | −18.58% | +4.92% | 10/37 | 37/37 |
| 180 days | 34 | −3.32% | +25.84% | 11/34 | 34/34 |
| 365 days | 28 | +19.17% | +55.57% | 13/28 | 28/28 |
Verify: Full four-horizon SUI/BTC results · All 136 matched SUI/BTC paths · Pending and missing horizon ledger
What is SUI used for, and does network growth automatically raise the token price?
Sui's official tokenomics describes SUI as the native asset used for gas fees and delegated proof-of-stake, with governance participation. The network's object-centric transaction design is a technical feature, not a token valuation formula. To move from protocol use to a token thesis, an investor still needs evidence of persistent user demand, fee economics, staking participation, future issuance and the rights of the specific token they buy.
Higher network activity need not map one-for-one into price. Fees may be small, issuance may offset demand, users may acquire and spend tokens rapidly, and speculative flows may dominate short windows. This article did not run an independent causal experiment linking Sui daily transactions or fees to SUI price; it therefore does not claim that Sui adoption caused either the winning or losing 90-day observations.
| Claim | Evidence status here | Still needed for investment research |
|---|---|---|
| SUI is the native fee/staking asset | Verified in official tokenomics | Current fee, stake and issuance observations |
| Network usage is rising | Not established by this price study | Date-aligned unique users, transactions and fees |
| Usage implies token price upside | Not established | Causal demand-versus-supply model and alternatives |
| Listed spot market has turnover | Measured historically on Binance | Current spread, order-book depth and venue access |
Verify: Sui official tokenomics · Sui official developer documentation
How do SUI circulating supply, FDV and token unlocks change the question?
In CoinGecko's frozen September 26 response, SUI was about $1.17, with roughly 4.10 billion tokens reported circulating against a 10 billion maximum. Using the same provider snapshot, the reported float ratio was 40.97%, circulating cap about $4.79 billion and FDV about $11.70 billion. These are provider-defined fields at one timestamp, not a direct claim about tomorrow's transferable balance. The separate FDV guide publishes the raw response and precise formulas.
Sui publishes an official token schedule, but its projected circulation and categories must not be flattened into a single 'all remaining tokens will sell' statement. Some tokens may be staked or held; schedules and reported circulating-supply definitions can change. The question for a potential buyer is which allocation becomes transferable in the horizon they care about, who receives it, whether it was already liquid through another mechanism and how actual market depth compares. The historical price study does not model these supply events.
| Dated September 26 supply example | Provider-reported value | Interpretation limit |
|---|---|---|
| Spot reference price | $1.17 | Snapshot, not a live entry quote |
| Circulating / maximum | 4.10bn / 10.00bn | CoinGecko definition, not a custody audit |
| Reported circulating share | 40.97% | Remainder is not one imminent release |
| Circulating cap / FDV | $4.79bn / $11.70bn | Price multiplied by supply fields, not fair value |
Verify: CoinGecko supply source and calculation · Sui official token schedule · CoinNudge FDV versus circulating-supply guide
How do SUI tokenomics, distribution and unlocks work?
Token economics are more than a supply number. Read the published allocation or issuance rule, then distinguish a scheduled eligibility event from actual market sales. Dated circulating-supply figures are in the section above; this explanation is based on the cited issuer and protocol documents reviewed on 2026-09-26.
For SUI, the decision-relevant questions are who receives new or released units, what the token is used for, whether ordinary holders have enforceable rights, and which claims still need contract or wallet verification. Neither a token unlock nor a staking yield alone predicts price.
| Token-economics dimension | Documented mechanism or attributed claim | What remains unproven / investor implication |
|---|---|---|
| Supply and allocation | SUI has a fixed 10 billion maximum supply. Sui says over half belongs to the Community Reserve initially managed by the Foundation; other allocations include early supporters and the Mysten Labs treasury. | The broad allocation is not the number of coins tradable today. |
| Release mechanism | The Foundation publishes a projected circulating-supply schedule and a current-month circulation API. Stake subsidies are counted when released; unstaking an already circulating reward does not create a second unlock. | Projected dates and realised transfers must be distinguished. |
| Use and rights | SUI pays gas, secures delegated staking and is documented for future on-chain governance. | It is not Mysten Labs equity and staking rewards are not a contractual fixed yield. |
| Investor check | Compare official monthly circulating numbers with the release projection, Foundation activity and venue liquidity. | Do not count locked staking balances as a new dilution event when withdrawn. |
Verify: Sui official supply schedule and circulation API · Sui Foundation staking and circulation explainer · Sui token allocation overview
What would show that Sui adoption is durable rather than incentive-driven?
Durable Sui growth needs repeated usage and economic demand, not a single high TVL or transaction count. Compare a consistent series of fee-paying activity, user return/retention, applications with real usage and stablecoin balances, while recording incentive changes and measurement definitions.
TVL in dollars can rise because token prices rise; transactions can reflect bots or sponsored activity. Ask whether users remain when rewards fall, whether activity is distributed among applications, and whether fee demand changes on the same dates. These checks are a diligence framework; this report has not collected a continuous, reconciled usage/retention panel.
SUI’s gas and delegated-staking role establishes a function, not a cash-flow right to all application revenue. A successful application can capture most of the value itself. The historical SUI/BTC price comparison measures holding outcomes and paths, not a causal link from a particular application to token returns.
| Evidence to obtain | Reason to inspect it | Potential false positive |
|---|---|---|
| Consistently defined recurring users | Repeat demand instead of one campaign | Bots, sybil accounts or changed definitions |
| Fee-paying activity through incentive changes | Economic use after subsidy | Reward-driven activity disappears |
| Application breadth and fees | Concentrated versus diversified demand | One application dominates headline count |
| Token role and supply | How demand could reach SUI holders | Network success treated as a shareholder payout |
Can SUI adoption grow while the token price still falls?
Yes. Token price depends on valuation relative to circulating units, not adoption alone. Under a consistent circulating-market-cap definition, price equals circulating market cap divided by circulating supply. More units can offset a higher total valuation.
In a hypothetical sensitivity—not a SUI forecast—if circulating market cap grows 20% while float grows 25%, price changes by 1.20/1.25 − 1 = −4%. With flat market cap and 25% float growth, the change is −20%. Conversely a supply release does not establish actual selling or a price decline; demand and available liquidity also matter.
The supply and valuation figures elsewhere in this report are frozen September 26 provider observations, not current quotes. Check the official projected circulation schedule, actual circulation and beneficiaries separately. Unlock eligibility, a provider forecast and tokens sold to the market are different facts.
| Illustrative scenario | Market-cap change | Float change | Implied price change |
|---|---|---|---|
| Growth partly offset by dilution | +20% | +25% | −4% |
| Flat valuation, larger float | 0% | +25% | −20% |
| SUI current valuation | Not updated in this frozen study | Verify current actual/projected figures | No forecast issued |
How should SUI fundamentals, valuation and a technical entry be combined?
Treat these as three independent questions: whether the network has durable demand, whether the token’s valuation and supply are acceptable, and whether a particular entry has a manageable loss. Passing one does not pass the other two.
A technical check should state completed-bar timeframe, current observation time, support/invalidation, liquidity for your size and the cost of waiting. Weekly trend, daily structure and a four-hour entry can be compared, but multiple indicators derived from the same price series are not independent proof. This frozen report does not publish a live SUI support level or a tested multi-indicator entry advantage.
The matched study supplies a caution about relative holding risk: 10 of 37 completed 90-day starts beat BTC, and SUI had the deeper daily-open drawdown in all 37. At 365 days, 13 of 28 beat BTC, with a +19.17% SUI median versus +55.57% BTC. Neither “SUI never wins” nor “hold longer and it must outperform” fits that evidence.
Verify: Inspect current market liquidity and participation · Interpret circulation, FDV and supply releases · Sui official projected token schedule
What would justify researching SUI further, waiting or rejecting an investment thesis?
Research further when there is verifiable recurring usage, a credible link to SUI demand and a valuation/supply scenario you can defend. Wait when those observations are incomplete or the execution risk does not fit your budget. Reject a specific thesis when its stated evidence fails—not because one past return was negative.
For example, an “adoption always lifts SUI price” thesis fails to account for float expansion and value capture. A “SUI can never beat BTC” thesis fails the published positive exceptions. A responsible thesis must survive both favorable and unfavorable holding starts, not only the September 2024 winner.
Write the invalidation and next verification date before buying. Use only a dated claim about this report’s evidence: historical paired outcomes and a fundamental/valuation checklist. It is not a current fair-value estimate, an issuer audit or a personalized hold recommendation.
What did SUI holders have to endure before the 90-day outcome?
Terminal return hides the route. On all 37 matched daily-open paths, SUI's maximum peak-to-trough decline was deeper than BTC's measured decline. For example, the April 1, 2024 start ended −59.12% in SUI versus −14.44% in BTC; SUI's observed interim drawdown reached −59.66%. The October 1, 2025 start ended −55.84% in SUI with −62.88% path drawdown. A position can be deeply underwater before any planned 90-day exit.
A counterexample belongs beside the losses: the September 1, 2024 SUI start gained +337.82%, yet even that path experienced a −25.24% daily-open drawdown. Whether a holder could follow a rule through such a move is a practical risk question, not visible from the final gain alone. Daily opens understate intraday extremes; leverage, funding, stops, liquidation and execution are not modelled, so a real margined trade could be worse or end earlier.
| Start date (UTC) | SUI day-90 return | BTC day-90 return | SUI max daily-open drawdown | Lesson |
|---|---|---|---|---|
| 2024-09-01 | +337.82% | +65.26% | −25.24% | Large upside still involved a material path loss |
| 2024-04-01 | −59.12% | −14.44% | −59.66% | Altcoin loss greatly exceeded BTC |
| 2025-10-01 | −55.84% | −23.51% | −62.88% | An unfavorable market state amplified risk |
Verify: Full matched-start ledger
How did the SUI-versus-BTC experiment avoid an easy cherry-pick?
We fixed monthly UTC starts beginning June 2023, after both SUI/USDT and BTC/USDT had a complete daily-open path in the stored Binance archive. The final entry is June 2026 so the 90-day exit is mature by the September 24 data cutoff. A pair is retained only if both assets have every required daily open. All 37 candidate pairs were complete; the public exclusion ledger is empty rather than silently dropping losses. The test uses spot daily opens and excludes fees, slippage, taxes, staking and network usage.
A 90-day result from monthly starts overlaps with adjacent results. As a sensitivity check we keep every third start: 12 more separated dates. Their median SUI-minus-BTC return was −5.81 percentage points, and SUI outperformed on 5/12. That weaker, smaller check does not demonstrate a stable predictive edge either way. The full sample includes both strong and weak SUI market episodes; it is a descriptive history, not a randomized trial or out-of-sample strategy backtest.
Current-market context uses a different clock: the local September 25 SUI/USDT archived close was about $1.1949 and trailing 30-day median USDT quote turnover about $60.23 million. Those observations show a liquid traded market in that venue window, not a current executable price, project revenue or a reason to enter.
| Study control | Applied rule | Residual uncertainty |
|---|---|---|
| Paired dates | 37 same-day SUI and BTC 90-day starts | Market cycles remain few |
| Completeness | Every daily open required for both | Current-survivor and venue bias |
| Overlap sensitivity | Every third start; n=12 | Still too small for a stable win-rate claim |
| Price clock | Historical UTC daily open | Not a point-in-time CoinNudge trading signal |
| Supply clock | Separate September 26 provider snapshot | Must not be merged into 2023–2026 entry knowledge |
Verify: Method and group JSON · Missing-pair ledger
Did each monthly SUI entry beat BTC, and how deep was the path?
The median and the exceptional September 2024 winner do not show what happened at every entry. These 37 matched monthly starts use the same 90-day UTC window for SUI and BTC. The “versus BTC” column is SUI’s percentage-point difference, not an additional return; the two drawdown columns show the worst daily-open path after each common start.
Read a positive SUI terminal return alongside both the BTC comparator and the interim drawdown. A row that beats BTC can still have forced an investor through a severe loss before the endpoint. Starts only one month apart share most of their days, so 37 rows do not represent 37 independent market regimes or a future outperformance probability.
| UTC start | SUI · 90d | BTC · 90d | SUI vs BTC | SUI max drawdown | BTC max drawdown | Relative result |
|---|---|---|---|---|---|---|
| 2023-06-01 | −44.05% | +1.86% | −45.91 pp | −51.24% | −17.29% | BTC ahead |
| 2023-07-01 | −35.06% | −11.32% | −23.74 pp | −42.10% | −20.00% | BTC ahead |
| 2023-08-01 | −28.37% | +18.11% | −46.48 pp | −42.74% | −15.48% | BTC ahead |
| 2023-09-01 | +20.10% | +45.93% | −25.82 pp | −26.98% | −5.59% | BTC ahead |
| 2023-10-01 | +71.36% | +56.02% | +15.34 pp | −26.98% | −6.61% | SUI ahead |
| 2023-11-01 | +252.85% | +25.01% | +227.84 pp | −22.67% | −15.72% | SUI ahead |
| 2023-12-01 | +165.22% | +65.50% | +99.72 pp | −22.67% | −15.72% | SUI ahead |
| 2024-01-01 | +142.55% | +64.56% | +77.99 pp | −26.72% | −15.72% | SUI ahead |
| 2024-02-01 | −24.71% | +42.49% | −67.20 pp | −48.87% | −16.97% | BTC ahead |
| 2024-03-01 | −39.39% | +10.67% | −50.06 pp | −56.80% | −20.13% | BTC ahead |
| 2024-04-01 | −59.12% | −14.44% | −44.68 pp | −59.66% | −18.51% | BTC ahead |
| 2024-05-01 | −35.27% | +10.07% | −45.35 pp | −44.21% | −21.82% | BTC ahead |
| 2024-06-01 | −21.52% | −12.11% | −9.41 pp | −51.95% | −24.03% | BTC ahead |
| 2024-07-01 | +105.72% | +4.92% | +100.80 pp | −38.33% | −20.93% | SUI ahead |
| 2024-08-01 | +193.00% | +12.55% | +180.45 pp | −25.28% | −17.43% | SUI ahead |
| 2024-09-01 | +337.82% | +65.26% | +272.56 pp | −25.24% | −8.74% | SUI ahead |
| 2024-10-01 | +130.65% | +48.02% | +82.63 pp | −25.24% | −11.68% | SUI ahead |
| 2024-11-01 | +87.60% | +47.57% | +40.02 pp | −30.94% | −12.80% | SUI ahead |
| 2024-12-01 | −18.58% | −12.51% | −6.07 pp | −47.28% | −20.63% | BTC ahead |
| 2025-01-01 | −45.00% | −11.78% | −33.22 pp | −60.51% | −25.95% | BTC ahead |
| 2025-02-01 | −13.16% | −5.80% | −7.36 pp | −53.00% | −25.49% | BTC ahead |
| 2025-03-01 | +24.57% | +25.18% | −0.61 pp | −39.83% | −19.04% | BTC ahead |
| 2025-04-01 | +27.89% | +31.26% | −3.38 pp | −40.56% | −10.38% | BTC ahead |
| 2025-05-01 | +8.78% | +25.25% | −16.47 pp | −40.56% | −9.61% | BTC ahead |
| 2025-06-01 | +1.13% | +3.62% | −2.49 pp | −29.87% | −12.11% | BTC ahead |
| 2025-07-01 | +18.02% | +4.68% | +13.34 pp | −28.08% | −12.21% | SUI ahead |
| 2025-08-01 | −30.49% | −4.96% | −25.53 pp | −40.52% | −14.62% | BTC ahead |
| 2025-09-01 | −53.87% | −16.11% | −37.76 pp | −65.41% | −32.02% | BTC ahead |
| 2025-10-01 | −55.84% | −23.51% | −32.33 pp | −62.88% | −32.02% | BTC ahead |
| 2025-11-01 | −44.11% | −22.77% | −21.34 pp | −44.49% | −23.42% | BTC ahead |
| 2025-12-01 | −39.61% | −25.88% | −13.73 pp | −54.85% | −35.11% | BTC ahead |
| 2026-01-01 | −37.46% | −22.09% | −15.37 pp | −55.52% | −35.11% | BTC ahead |
| 2026-02-01 | −20.32% | −0.65% | −19.67 pp | −26.57% | −20.11% | BTC ahead |
| 2026-03-01 | +0.13% | +9.69% | −9.55 pp | −32.07% | −11.85% | BTC ahead |
| 2026-04-01 | −19.99% | −11.75% | −8.24 pp | −48.86% | −27.53% | BTC ahead |
| 2026-05-01 | −24.45% | −16.19% | −8.26 pp | −48.89% | −28.69% | BTC ahead |
| 2026-06-01 | −16.80% | +6.18% | −22.98 pp | −27.21% | −20.43% | BTC ahead |
Verify: All 37 matched outcomes and paths · SUI/BTC row-level CSV
What should someone check before deciding whether to buy SUI today?
First define the horizon, amount at risk and decision rule. A 90-day spot investment and a leveraged five-minute trade ask different questions. For a longer-horizon thesis, verify Sui usage and fee data from primary network sources; update the token schedule and supply classification; compare valuation with other Layer 1 assets using the same supply definitions. For execution, check today’s spread and depth, not just our archived turnover.
If the thesis depends on 'SUI will outperform BTC,' explicitly ask what evidence would falsify it. The 37-start ledger contains both exceptional SUI winners and many relative losers, while the drawdown result tests whether a planned position size is credible. An alert can tell you that current volume, price or positioning changed; it cannot make issuer claims true or eliminate a 50%-plus historical path risk. Consider a no-trade or wait decision when a key fact remains unknown.
Verify: Sui schedule · Live market overview · SUI among Layer 1 sector comparisons
Can a reader reproduce the SUI/BTC returns and drawdowns?
Yes. Download the 37-pair CSV, full JSON, empty-exclusion CSV and daily-open input CSV. For each monthly start, calculate each asset's 90-day open-to-open return as exit/start − 1. Record SUI minus BTC in percentage points. From every daily open between entry and exit, calculate drawdown as current open divided by the running maximum minus one; take its minimum. Sort the 37 values to reproduce ordinary medians and 10th/90th percentiles using linear interpolation. The quarterly sensitivity is every third retained monthly start, not a fresh optimized subset.
The full input file includes source archive hashes and capture timestamps. It makes clear that the historical candles were recovered or revised later and cannot masquerade as at-the-time proprietary observations. The manifest hashes every published file, and the chart is derived from the same frozen JSON. More observations or a different exit horizon would require a new version and a newly stated hypothesis.
| Evidence file | Independent check | Not established |
|---|---|---|
| 37-pair outcomes | Returns, BTC excess and path drawdowns | Future price direction |
| Daily input candles | Exact historical UTC price path | Real fills or intraday liquidation |
| Exclusion ledger | Zero missing matched pairs | Absence of survivor bias |
| SHA-256 manifest | Published evidence integrity | Provider supply field correctness |
Verify: Full SUI study JSON · 37-pair observations CSV · Daily input CSV · Release manifest
Take the next step with this evidence.
Choose ongoing Telegram monitoring or inspect structured data in your own research workflow.
Receive qualifying events in Telegram.
Use the ready-made alert checklist, message explanations and daily briefing. Check the supported categories and coins before subscribing; every Research page is not a separate alert category.
Check the alert list · View alert plans
Inspect the data before choosing a pack.
Prepared research packs supply scoped features, separate outcomes where available and quality flags. Buy a fixed edition once and download directly; API use is optional.
Check data pack samples · Explore the full data catalog · Compare data plans
Each purchased pack includes its specified fields and published date range. This page's full dataset is not automatically included. Other data families require coverage, date, field and source-use confirmation before purchase. Telegram Pro is a separate 30-day service; historical packs are one-time purchases.
Frequently asked questions
Is SUI a good crypto to buy now?
No historical study can answer that for everyone. The 37 matched SUI/BTC 90-day starts had a −18.58% SUI median and deeper SUI drawdown in all 37, but also some large positive exceptions. Update current usage, supply and liquidity before making a personal decision.
What does the SUI token do?
Sui's official tokenomics describes SUI as its native gas and delegated-staking asset with governance participation. That role does not automatically mean network growth will lift price.
How much SUI supply is circulating?
In a frozen September 26 CoinGecko response, roughly 4.10 billion of a 10 billion maximum was reported circulating, about 40.97%. This is provider-defined and date-specific; consult the latest data and official schedule.
Does an upcoming SUI unlock mean the price will fall?
No. A release schedule indicates possible availability under stated terms, not actual selling, net market inflow or a guaranteed price reaction.
Did SUI ever outperform Bitcoin strongly?
Yes. The September 1, 2024 matched 90-day start returned about +337.82% for SUI versus +65.26% BTC. Selecting that one period would hide the negative overall SUI median and path risk.
Is the 10/37 SUI outperformance count a future probability?
No. Monthly 90-day windows overlap and come from a few market regimes; 10/37 is a descriptive past count, not independent trial odds or a predictive model.
Does this include futures leverage or real trading costs?
No. It uses Binance USDT spot daily opens before fees, slippage, funding, taxes or leverage. Daily opens also understate intraday price extremes.
Does SUI look better if held for one year instead of 90 days?
In 28 completed matched 365-day starts SUI's median return was +19.17%, but BTC's was +55.57%; SUI beat BTC in 13/28 and had the deeper daily-open drawdown in all 28. Fewer mature starts and overlapping windows limit inference.
Can SUI rise over 90 days but still underperform Bitcoin?
Yes. Six of the 37 matched 90-day monthly starts had a positive SUI terminal return but a lower return than BTC on the same dates. The page publishes every paired start, both drawdowns and the SUI-minus-BTC percentage-point difference so this opportunity-cost question is visible.
Does Sui TVL growth prove SUI is undervalued?
No. Dollar TVL can change with prices and incentives. A valuation thesis also needs consistent usage, token value-capture mechanisms, circulation and supply scenarios.
Are the valuation and supply numbers current today?
No. This study preserves dated September 26 observations and frozen matched price evidence. Verify the current official projected schedule and actual market data separately.
What are SUI tokenomics?
SUI has a 10 billion cap and staged circulation; over half was assigned to a Foundation-managed Community Reserve. SUI pays gas and secures staking. The official monthly circulation API is the right source for actual float; a projection is not a confirmed sale.
Sources and verification
- CoinNudge matched SUI/BTC studyFrozen 37-start groups, counterexamples and deterministic protocol.
- Matched start ledgerEvery SUI and BTC 90-day result and drawdown.
- Four-horizon SUI/BTC sensitivity30/90/180/365-day matched results, candidate maturity and risk checks.
- Sui official tokenomicsPrimary description of SUI gas, staking and governance roles.
- Sui official token scheduleProject-published circulation schedule, not a sell-flow forecast.
- CoinGecko supply sourceProvider fields for the dated supply example.
- Binance Spot Kline definitionsHistorical daily spot open and quote-volume field meanings.
- Sui Foundation staking and circulation explainer
- Sui token allocation overview
Check present market conditions and the latest supply terms.
Use the dated study as a risk checklist, then verify today's liquidity and any official schedule changes separately.
Explore current market context