Cross-sector historical research report · By CoinNudge Research · · Guide updated 2026-09-26 · 38 min read
Which crypto coins are worth researching in each sector?
For a sector-by-sector research shortlist, start with ETH and SOL in Layer 1, UNI and ENA in DeFi, DOGE and PEPE in Meme, TAO and WLD in AI, and ONDO and PENDLE in RWA. These are the study’s liquidity anchors—not a buy list. In the shared 90-day window ending September 24, 2026, DeFi’s median return was +68.35%, Meme +55.65% and AI +14.49%, versus BTC +41.15%; popularity did not ensure outperformance. The report compares 14 overlapping categories and grades 107 eligible assignments across 86 Binance spot coins, with per-coin returns, drawdowns and turnover. Check token economics and current liquidity before acting; historical grades do not forecast returns.
Download all 107 graded rows · See current sector heatmap
What is the practical answer before choosing a crypto sector coin?
- Every one of the 14 sectors now names and grades every eligible coin. A–E describes only the past price path; it does not rate project quality or tell you what to buy.
- This release has 281 candidate sector assignments from 235 distinct symbols. The complete 90-day history and $1m median daily quote-turnover gates retain 107 assignments across 86 distinct coins; 174 assignments are excluded with reasons.
- The shortlist separates liquid anchors, a recent-strength case and a weaker 90-day comparison. The per-coin tables let you compare 7/30/90 days, BTC-relative return, drawdown and turnover before checking fundamentals and current execution.
Which crypto sectors had broad participation, and which depended on a few coins?
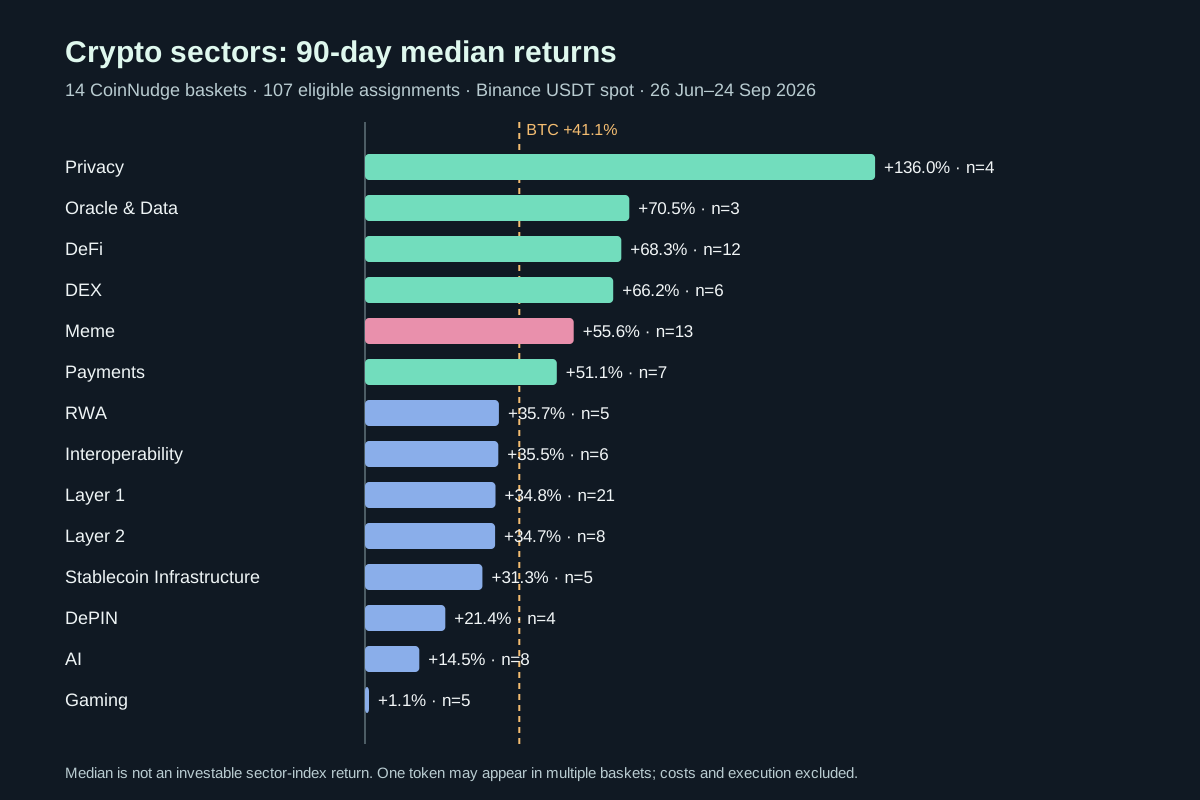
The main hypothesis was that a strong sector label should be supported by several liquid members, not one spectacular coin. The 14-category table reports median return and the number of members above BTC on the same dates. Privacy had the highest 90-day median (+136.02%), but only four qualifying members; DeFi had +68.35% with nine of 12 above BTC; Meme had +55.65% with eight of 13 above BTC. Gaming had a +1.08% median despite an extreme winning member. These are descriptive differences during one market period, not proof of persistent sector leadership.
Shorter windows can reverse the interpretation. Meme's 90-day median was +55.65%, while its most recent 30-day median was only +3.11%. DeFi's 90-day median was +68.35% but its last 30-day median was +6.55%. A historic 90-day winner does not mean every included token is currently gaining. Conversely, Privacy's four qualifying coins all exceeded BTC in this window, but a four-member group and overlapping market conditions cannot establish an independent predictive advantage.
| Crypto sector | Coins | 7d median | 30d median | 90d median | Beat BTC / n | Median path drawdown |
|---|---|---|---|---|---|---|
| Layer 1 | 21 | +18.29% | +16.18% | +34.79% | 8 / 21 | −16.93% |
| Layer 2 | 8 | +26.66% | +31.81% | +34.71% | 3 / 8 | −29.64% |
| DeFi | 12 | +17.48% | +6.55% | +68.35% | 9 / 12 | −22.92% |
| Meme | 13 | +14.61% | +3.11% | +55.65% | 8 / 13 | −30.75% |
| AI | 8 | +19.45% | +12.65% | +14.49% | 1 / 8 | −34.35% |
| RWA | 5 | +22.13% | +8.07% | +35.71% | 2 / 5 | −22.21% |
| Gaming | 5 | +16.76% | −1.19% | +1.08% | 2 / 5 | −34.65% |
| DePIN | 4 | +28.31% | +36.18% | +21.42% | 1 / 4 | −22.10% |
| DEX | 6 | +13.67% | +31.32% | +66.19% | 3 / 6 | −22.51% |
| Oracle & Data | 3 | +11.74% | +6.25% | +70.47% | 2 / 3 | −24.50% |
| Privacy | 4 | +8.94% | +46.14% | +136.02% | 4 / 4 | −24.51% |
| Payments | 7 | +17.32% | +19.75% | +51.15% | 5 / 7 | −15.60% |
| Interoperability | 6 | +11.62% | +13.63% | +35.54% | 2 / 6 | −25.32% |
| Stablecoin Infrastructure | 5 | +18.73% | +6.06% | +31.32% | 1 / 5 | −22.21% |
Which representative crypto coins should you research in each sector?
Start with the two liquid anchors in each row, then compare the recent-strength and weaker 90-day cases. These are dated research starting points—not buy ratings. The full selection rule and all eligible coins follow immediately below.
| Crypto sector | Liquidity anchors to research | Recent-strength case | 90-day comparison case |
|---|---|---|---|
| Layer 1 | ETH · SOL | NEAR | SEI |
| Layer 2 | ARB · POL | STRK | ZK |
| DeFi | UNI · ENA | RAY | JTO |
| Meme | DOGE · PEPE | MUBARAK | BONK |
| AI | TAO · WLD | ZAMA | KAITO |
| RWA | ONDO · PENDLE | PLUME | CFG |
| Gaming | ACE · GALA | SAGA | SAND |
| DePIN | FIL · RENDER | AR | 0G |
| DEX | UNI · ASTER | RAY | DODO |
| Oracle & Data | LINK · PYTH | — | KAITO |
| Privacy | ZEC · DASH | ZAMA | ZEN |
| Payments | XRP · LTC | VET | XLM |
| Interoperability | LINK · DOT | ZRO | BICO |
| Stablecoin Infrastructure | ENA · ONDO | SPK | WLFI |
Verify: All member-level returns, drawdowns and turnover · Frozen category definitions and screen
Which eligible coins are actually in all 14 crypto sectors?
The table below makes the complete included universe visible on the page; it is not limited to the four-name shortlist or the Meme case study. Names follow the frozen CoinNudge category membership and the same history/liquidity screen. A ticker can belong to multiple categories, so 107 sector assignments mean 86 distinct coins, not 107 independent opportunities. The 174 excluded assignments and their exact reasons are published separately.
| Crypto sector | Eligible coins | Every included symbol in this release |
|---|---|---|
| Layer 1 | 21 | ADA · ALGO · APT · ATOM · AVAX · BNB · DOT · ETC · ETH · HBAR · ICP · INJ · NEAR · SEI · SOL · SUI · TIA · TRX · VET · XLM · XRP |
| Layer 2 | 8 | ARB · HEMI · LSK · OP · POL · STRK · ZK · ZRO |
| DeFi | 12 | AAVE · CAKE · CRV · ENA · JTO · LDO · MORPHO · ONDO · PENDLE · RAY · SKY · UNI |
| Meme | 13 | BOME · BONK · DOGE · FLOKI · GIGGLE · MUBARAK · NEIRO · PENGU · PEPE · SHIB · TRUMP · TST · WIF |
| AI | 8 | FET · KAITO · RENDER · SAHARA · TAO · VIRTUAL · WLD · ZAMA |
| RWA | 5 | CFG · ONDO · PENDLE · PLUME · SKY |
| Gaming | 5 | ACE · AXS · GALA · SAGA · SAND |
| DePIN | 4 | 0G · AR · FIL · RENDER |
| DEX | 6 | ASTER · CAKE · DODO · ORCA · RAY · UNI |
| Oracle & Data | 3 | KAITO · LINK · PYTH |
| Privacy | 4 | DASH · ZAMA · ZEC · ZEN |
| Payments | 7 | ALGO · BCH · COTI · LTC · VET · XLM · XRP |
| Interoperability | 6 | ATOM · BICO · DOT · LINK · POL · ZRO |
| Stablecoin Infrastructure | 5 | ENA · ONDO · SKY · SPK · WLFI |
Verify: 107 included sector assignments · All 281 candidates and exclusion reasons
How are the A–E crypto coin growth-trend grades calculated?
The grade is a deterministic description of the June 26–September 24, 2026 Binance USDT spot price path, applied to all 107 eligible sector assignments in order from A to E. Return is daily-open to daily-open; the recent 7 and 30 days are nested inside the same 90 days, not independent tests. A needs strong 90-day growth, positive shorter windows and a daily-open drawdown no deeper than 35%. B needs positive 90/30/7-day alignment but may still have a large drawdown, so the risk column remains essential.
C means the 90-day endpoint was nonnegative without A/B confirmation; it can include a large earlier rise followed by a weak month, not just a flat price. D means the 90-day result was negative but the latest 30 days rebounded. E means both the 90-day return and the most recent 30-day return were negative or flat. The cutoffs are fixed descriptive bins, not thresholds optimized on future returns. A is not an investment-quality score, E is not a prediction of further losses, and overlapping sector labels do not give one token multiple independent observations. Excluded/new/off-venue candidates receive no grade rather than an artificial zero.
The letter deliberately differs from a simple 90-day gain ranking. LSK rose +335.86% over 90 days but receives C because its last seven days fell 25.41%; MUBARAK rose +439.84% but receives B because its 37.98% daily-open drawdown exceeds A's 35% cap. WIF's smaller +62.38% move receives A because its 30-day and seven-day windows were positive and its measured drawdown stayed inside that cap. This comparison is historical, not evidence that WIF is a better current investment.
| Historical trend grade | Exact rule, checked in order | How to read it |
|---|---|---|
| A · strong aligned growth | 90d ≥ +50%; 30d ≥ +10%; 7d > 0%; 90d daily-open drawdown ≥ −35% | Strong endpoint and recent continuation, within this drawdown cap |
| B · positive, recently confirmed | Not A; 90d ≥ +20%; 30d > 0%; 7d > 0% | Positive path; inspect the separate drawdown column |
| C · positive but mixed or mild | Not A/B; 90d ≥ 0% | Positive endpoint without stronger short-window confirmation |
| D · rebound inside 90-day loss | 90d < 0%; 30d > 0% | Recent bounce has not erased the 90-day loss |
| E · 90-day and 30-day decline | 90d < 0%; 30d ≤ 0% | Both endpoint and recent month remain weak |
Verify: Frozen grade rules, full data and counts · Grade field dictionary and boundaries · Binance Spot candle fields
How many coins in each crypto sector showed 90-day growth?
Across 107 eligible sector assignments (86 distinct coins), 31 received historical trend grade A, 36 B, 30 C, 4 D and 6 E. The assignments overlap across sectors; these are counts of dated price paths, not independent forecasts or investment-quality ratings.
Use the grade count to see whether a sector had broad confirmed growth or relied on a few winners. Then inspect each coin below: two names with the same letter can have very different 90-day returns, BTC-relative results, drawdowns and liquidity. A positive absolute return can still lag Bitcoin in this shared market period.
| Crypto sector | Coins | A · strong | B · positive | C · mixed | D · rebound | E · decline |
|---|---|---|---|---|---|---|
| Layer 1 | 21 | 5 | 12 | 4 | 0 | 0 |
| Layer 2 | 8 | 2 | 1 | 5 | 0 | 0 |
| DeFi | 12 | 5 | 4 | 2 | 0 | 1 |
| Meme | 13 | 1 | 7 | 4 | 1 | 0 |
| AI | 8 | 1 | 1 | 3 | 2 | 1 |
| RWA | 5 | 2 | 2 | 0 | 1 | 0 |
| Gaming | 5 | 1 | 0 | 2 | 0 | 2 |
| DePIN | 4 | 1 | 1 | 2 | 0 | 0 |
| DEX | 6 | 3 | 1 | 2 | 0 | 0 |
| Oracle & Data | 3 | 1 | 1 | 0 | 0 | 1 |
| Privacy | 4 | 4 | 0 | 0 | 0 | 0 |
| Payments | 7 | 3 | 2 | 2 | 0 | 0 |
| Interoperability | 6 | 1 | 2 | 3 | 0 | 0 |
| Stablecoin Infrastructure | 5 | 1 | 2 | 1 | 0 | 1 |
Verify: Complete grade data (JSON) · All 107 graded sector assignments (CSV) · Independent grade verifier and file hashes
How were the representative sector coins selected, and what do the labels mean?
This is a reproducible research-starting list, not a ranking of coins to buy today. Within each eligible sector, the first two names have the highest median Binance USDT spot quote turnover over the final 30 days. Among the remaining names, the recent-strength case has the highest positive 30-day return with a 90-day daily-open drawdown no worse than 40%; if none qualifies, that cell is blank. The comparison case has the lowest 90-day return among those left. Ties use higher turnover and then ticker. A comparison case can still have a positive return: its purpose is to challenge the sector narrative, not label the project bad.
This rule favors observable liquidity and contrasting paths, not token utility, valuation or future returns. For example, the Layer 1 starting pair is ETH and SOL, while NEAR tests recent strength and SEI tests the weaker 90-day path. Meme starts with DOGE and PEPE, then contrasts MUBARAK's sharp rise with BONK's loss. All figures are frozen at September 24, 2026; inspect current depth, supply and issuer evidence before making any decision.
Verify: All member-level selection inputs · Frozen sector protocol
Which Meme coins did the study include, and what did the data really show?
Meme is a real category in CoinNudge's 50-theme taxonomy, and its omission from the first edition was a research-design error. This edition screened every one of the taxonomy's 28 Meme members under the same date and liquidity rules as other categories. Thirteen qualified: BOME, BONK, DOGE, FLOKI, GIGGLE, MUBARAK, NEIRO, PENGU, PEPE, SHIB, TRUMP, TST and WIF. The remaining 15 candidate assignments are in the exclusion ledger. An excluded coin is not judged worthless; it simply lacks this study's complete Binance 90-day path or $1m median quote turnover.
MUBARAK gained +439.84% in the measured window, but that is an outlier, not the group's expected return. The median across the 13 is +55.65%; BONK lost 13.51% and had a −55.02% daily-open maximum drawdown. DOGE had the largest trailing median spot turnover in this group, about $67.71m per day, yet its +23.81% return lagged BTC. PEPE gained +83.47% with about $28.96m median turnover. These comparisons show that entry timing, downside path and execution capacity differ even among tokens with the same label.
The 30-day versus 90-day split matters: BOME was up +152.62% across 90 days but down 10.77% during the last 30; TRUMP was up 19.65% across 90 days but down 17.80% during the last 30. Buying merely because a sector's 90-day statistic is high would miss that recent reversal. No table here measures social sentiment, holder concentration, insider wallets or current order-book depth; those are separate checks before trading.
| Meme coin | 30d return | 90d return | 90d max drawdown | 30d median turnover |
|---|---|---|---|---|
| BOME | −10.77% | +152.62% | −32.17% | $1.94m |
| BONK | +9.66% | −13.51% | −55.02% | $3.55m |
| DOGE | +2.91% | +23.81% | −14.27% | $67.71m |
| FLOKI | +1.30% | +23.52% | −20.05% | $1.84m |
| GIGGLE | +7.64% | +55.65% | −36.58% | $3.82m |
| MUBARAK | +120.94% | +439.84% | −37.98% | $2.07m |
| NEIRO | −4.86% | +41.20% | −24.58% | $1.49m |
| PENGU | −0.80% | +66.17% | −30.75% | $9.56m |
| PEPE | +7.18% | +83.47% | −21.36% | $28.96m |
| SHIB | +3.11% | +32.71% | −17.14% | $4.21m |
| TRUMP | −17.80% | +19.65% | −31.24% | $26.36m |
| TST | +10.28% | +63.23% | −36.03% | $1.49m |
| WIF | +15.94% | +62.38% | −25.75% | $2.30m |
How do you compare Layer 1, Layer 2, DeFi, DEX and RWA coin candidates?
Layer 1 — Start with ETH and SOL as the two largest eligible turnover references ($698.59m and $230.40m median daily quote volume), not because they must outperform. NEAR's +121.59% last-30-day move is a recent-strength case, but its −23.13% 90-day open-to-open path drawdown challenges a simple momentum story. SEI gained only +3.04% over 90 days and had a −32.66% drawdown. Compare fees, users, security budget, future issuance and whether network use has a credible path to token demand before treating any chain as the better investment.
Layer 2 — ARB ($36.35m median daily turnover) and POL ($7.41m) are the most liquid research anchors in this eligible basket. Their last-30-day paths diverged sharply: ARB +122.81% versus POL −12.99%. STRK's +41.86% is the recent-strength comparison; ZK's +9.71% 90-day return and −34.06% drawdown are the lower-return check. For each, separate rollup adoption and security from the token's governance, fee and issuance rights; a busy network does not automatically pay its token holder.
DeFi — UNI and ENA led this basket on turnover ($67.32m and $39.73m median daily), yet their economic models should not be merged into one 'DeFi coin' thesis. RAY's +157.94% recent 30-day move tests a stronger price path, while JTO lost 35.34% over 90 days and reached a −50.76% daily-open drawdown. Ask which protocol fees, if any, accrue to the specific token, what incentives subsidize usage, and how unlocks or governance can change that link.
DEX — UNI and ASTER supply the highest-turnover comparison ($67.32m versus $11.18m), while RAY's +157.94% 30-day return is a much faster but separate path. DODO's +5.97% 90-day return and −36.57% drawdown show why 'DEX volume is up' is not a token-return conclusion. Compare actual trading volume, fee routing, token claims and venue concentration; UNI and RAY also appear in DeFi, so this is not an independent second sample.
RWA — ONDO and PENDLE are the highest-turnover eligible names ($12.29m and $4.66m). PLUME had +13.77% in the last 30 days, while CFG lost 31.15% over 90 days and had a −53.36% drawdown. These are not interchangeable claims on real-world assets: verify the legal instrument, redemption rights, collateral or receivables, and whether the traded token is merely a governance or platform token. Price and turnover cannot answer those legal questions.
Verify: Member-level returns, volume and path risk · FDV, float and unlock comparison · Pendle protocol design (official)
Which Meme, AI, gaming and DePIN coins make useful research comparisons?
Meme — DOGE and PEPE are the two turnover anchors ($67.71m and $28.96m median daily), but the contrast is more informative than a popularity ranking. MUBARAK rose +120.94% in the last 30 days with a −37.98% 90-day path drawdown; BONK lost 13.51% over 90 days and drew down 55.02%. Read the complete 13-coin table above, then check contract identity, holder concentration, venue depth and whether attention is durable. A Meme category label does not imply any enforceable token cash flow.
AI — TAO and WLD provide the largest-turnover eligible comparison ($23.85m and $22.81m), but WLD's 90-day return was −18.11% while TAO's was +35.15%. ZAMA's +53.85% last-30-day move is a recent-strength case; KAITO's −28.93% 90-day return and −77.75% daily-open drawdown are a clear failure case. The taxonomy groups different AI/data mechanisms: require evidence of paying demand, token necessity, emissions and holder rights rather than treating an AI label as revenue participation.
Gaming — ACE and GALA were the two highest-turnover eligible names, but that meant only $2.79m and $1.80m median daily quote volume. SAGA rose +218.75% in 30 days; SAND fell 14.24% over 90 days. These thin and divergent paths make a sector-wide buy claim especially weak. Check player retention, spending, token sinks and whether a game's success reaches the traded token; quote turnover still does not measure executable depth.
DePIN — FIL and RENDER anchor turnover at $10.96m and $3.99m per day. AR gained +86.12% in the last 30 days with a −18.81% 90-day daily-open drawdown, whereas 0G's 90-day drawdown reached −43.21%. File storage, compute and network services have different economics. Verify paid usage, customer concentration, token settlement, operator rewards and subsidies before comparing their prices as if they represented the same business.
Verify: All included sector coins and measurements · Candidate and exclusion ledger
Which Oracle, Privacy, Payments, Interoperability and Stablecoin Infrastructure coins should you compare?
Oracle & Data — LINK and PYTH are the two turnover anchors ($30.52m and $3.07m median daily). LINK gained +70.47% and PYTH +93.09% over 90 days, while the third eligible member KAITO lost 28.93% and had a −77.75% drawdown. This basket spans oracle and data-related functions; do not infer that each token sells the same service. Check customer demand, data quality, fees and who—if anyone—receives their economic value.
Privacy — ZEC and DASH had the largest eligible turnover ($290.98m and $18.71m). ZAMA's +53.85% recent 30-day move is a different privacy-computation path; ZEN is the remaining comparison and still gained +76.06% over 90 days. All four exceeded BTC in this one window, so 'comparison case' does not mean a losing token. Contrast transaction privacy, privacy computation, access rules, supply and regulatory/venue risk rather than ranking unlike mechanisms by one return number.
Payments — XRP and LTC led turnover at $210.41m and $18.32m per day. VET's +55.35% last-30-day return is a recent-strength case, but XLM's +12.97% 90-day return and −25.05% path drawdown provide a weaker comparison. A coin can be tagged Payments and Layer 1 simultaneously. Verify actual payment usage, settlement costs, asset rights and whether the traded token necessarily benefits from network traffic.
Interoperability — LINK and DOT are the two turnover anchors ($30.52m and $9.55m). ZRO rose +37.61% in the last 30 days; BICO gained only +3.70% over 90 days and suffered a −73.05% daily-open drawdown. These projects address different cross-network problems, so compare security assumptions, bridge/message adoption and token-value capture rather than treating 'interoperability' as one product or one trade.
Stablecoin Infrastructure — ENA and ONDO lead eligible turnover at $39.73m and $12.29m, SPK offers the strongest qualifying recent path among the remaining names (+6.06% over 30 days), and WLFI lost 7.02% over 90 days. These are infrastructure or platform tokens, not stablecoins and not interchangeable redemption claims. Review reserves, counterparties, legal rights, peg mechanisms and whether the specific token receives fees; an infrastructure label cannot substitute for those checks.
Verify: Frozen prices, turnover and drawdowns by symbol · Source protocol and taxonomy overlap · Zama confidential computation (official)
Which Layer 1 coins had the strongest 90-day growth trend?
Layer 1 has 21 eligible coin assignments in the June 26–September 24, 2026 window (5 A · 12 B · 4 C · 0 D · 0 E). NEAR had the highest 90-day endpoint return (+136.08%), while SEI had the lowest (+3.04%). These endpoints do not tell you the price path or future odds by themselves; compare the grade, recent 7/30-day direction, BTC-relative return and maximum daily-open drawdown in the table.
| Coin | 90d trend grade | 90d return | 30d return | 7d return | Vs BTC · 90d | 90d max drawdown | 30d median turnover |
|---|---|---|---|---|---|---|---|
| NEAR | A · Strong aligned growth | +136.08% | +121.59% | +65.28% | +94.93 pp | −23.13% | $53.48m |
| VET | A · Strong aligned growth | +97.42% | +55.35% | +22.58% | +56.27 pp | −12.31% | $2.00m |
| INJ | A · Strong aligned growth | +82.36% | +37.04% | +44.21% | +41.21 pp | −23.64% | $8.65m |
| SOL | A · Strong aligned growth | +69.80% | +16.18% | +16.55% | +28.66 pp | −12.63% | $230.40m |
| AVAX | A · Strong aligned growth | +64.65% | +36.08% | +37.28% | +23.51 pp | −11.14% | $18.86m |
| ETH | B · Positive, recently confirmed | +71.23% | +8.15% | +11.02% | +30.09 pp | −5.62% | $698.59m |
| ADA | B · Positive, recently confirmed | +65.79% | +7.68% | +21.38% | +24.64 pp | −19.00% | $31.67m |
| XRP | B · Positive, recently confirmed | +43.83% | +1.30% | +15.50% | +2.68 pp | −15.60% | $210.41m |
| SUI | B · Positive, recently confirmed | +40.37% | +20.04% | +34.54% | −0.78 pp | −19.22% | $57.45m |
| BNB | B · Positive, recently confirmed | +36.88% | +8.96% | +5.71% | −4.27 pp | −7.54% | $97.62m |
| ICP | B · Positive, recently confirmed | +34.79% | +20.92% | +13.81% | −6.35 pp | −16.93% | $6.88m |
| DOT | B · Positive, recently confirmed | +30.72% | +22.58% | +8.04% | −10.42 pp | −24.24% | $9.55m |
| TIA | B · Positive, recently confirmed | +29.26% | +23.87% | +34.82% | −11.89 pp | −28.22% | $2.96m |
| APT | B · Positive, recently confirmed | +27.00% | +24.08% | +35.93% | −14.14 pp | −20.18% | $7.19m |
| ETC | B · Positive, recently confirmed | +24.01% | +12.50% | +18.29% | −17.14 pp | −16.49% | $2.27m |
| HBAR | B · Positive, recently confirmed | +23.18% | +14.15% | +22.45% | −17.97 pp | −16.34% | $8.04m |
| ALGO | B · Positive, recently confirmed | +22.85% | +13.62% | +17.32% | −18.30 pp | −14.93% | $2.46m |
| XLM | C · Positive but mixed or mild | +12.97% | +4.34% | +9.84% | −28.18 pp | −25.05% | $15.06m |
| TRX | C · Positive but mixed or mild | +5.65% | −0.81% | +1.97% | −35.50 pp | −6.55% | $32.02m |
| ATOM | C · Positive but mixed or mild | +5.21% | +11.42% | +11.50% | −35.94 pp | −24.12% | $2.36m |
| SEI | C · Positive but mixed or mild | +3.04% | +25.62% | +36.80% | −38.11 pp | −32.66% | $3.70m |
Which Layer 2 coins had the strongest 90-day growth trend?
Layer 2 has 8 eligible coin assignments in the June 26–September 24, 2026 window (2 A · 1 B · 5 C · 0 D · 0 E). LSK had the highest 90-day endpoint return (+335.86%), while ZK had the lowest (+9.71%). These endpoints do not tell you the price path or future odds by themselves; compare the grade, recent 7/30-day direction, BTC-relative return and maximum daily-open drawdown in the table.
| Coin | 90d trend grade | 90d return | 30d return | 7d return | Vs BTC · 90d | 90d max drawdown | 30d median turnover |
|---|---|---|---|---|---|---|---|
| ARB | A · Strong aligned growth | +194.54% | +122.81% | +28.36% | +153.40 pp | −29.69% | $36.35m |
| ZRO | A · Strong aligned growth | +83.60% | +37.61% | +51.06% | +42.45 pp | −29.60% | $6.36m |
| STRK | B · Positive, recently confirmed | +29.06% | +41.86% | +37.33% | −12.09 pp | −29.56% | $2.82m |
| LSK | C · Positive but mixed or mild | +335.86% | +286.23% | −25.41% | +294.72 pp | −59.73% | $1.76m |
| POL | C · Positive but mixed or mild | +40.35% | −12.99% | +4.63% | −0.79 pp | −26.40% | $7.41m |
| HEMI | C · Positive but mixed or mild | +26.83% | −19.33% | −4.87% | −14.31 pp | −63.09% | $6.96m |
| OP | C · Positive but mixed or mild | +16.38% | +14.11% | +28.15% | −24.76 pp | −24.40% | $6.41m |
| ZK | C · Positive but mixed or mild | +9.71% | +26.01% | +25.17% | −31.44 pp | −34.06% | $1.82m |
Which DeFi coins had the strongest 90-day growth trend?
DeFi has 12 eligible coin assignments in the June 26–September 24, 2026 window (5 A · 4 B · 2 C · 0 D · 1 E). RAY had the highest 90-day endpoint return (+233.85%), while JTO had the lowest (−35.34%). These endpoints do not tell you the price path or future odds by themselves; compare the grade, recent 7/30-day direction, BTC-relative return and maximum daily-open drawdown in the table.
| Coin | 90d trend grade | 90d return | 30d return | 7d return | Vs BTC · 90d | 90d max drawdown | 30d median turnover |
|---|---|---|---|---|---|---|---|
| RAY | A · Strong aligned growth | +233.85% | +157.94% | +42.21% | +192.70 pp | −26.13% | $7.30m |
| UNI | A · Strong aligned growth | +220.24% | +113.39% | +37.71% | +179.09 pp | −27.78% | $67.32m |
| ENA | A · Strong aligned growth | +150.00% | +34.91% | +38.44% | +108.85 pp | −22.76% | $39.73m |
| PENDLE | A · Strong aligned growth | +98.07% | +39.43% | +5.92% | +56.93 pp | −23.09% | $4.66m |
| CAKE | A · Strong aligned growth | +94.31% | +45.26% | +10.87% | +53.16 pp | −6.93% | $7.57m |
| AAVE | B · Positive, recently confirmed | +68.51% | +5.03% | +16.23% | +27.36 pp | −15.51% | $15.29m |
| LDO | B · Positive, recently confirmed | +56.61% | +3.58% | +10.47% | +15.46 pp | −29.79% | $3.32m |
| SKY | B · Positive, recently confirmed | +35.71% | +2.55% | +22.13% | −5.44 pp | −21.83% | $1.47m |
| ONDO | B · Positive, recently confirmed | +31.32% | +8.07% | +18.73% | −9.83 pp | −22.21% | $12.29m |
| CRV | C · Positive but mixed or mild | +68.18% | −4.02% | +1.34% | +27.04 pp | −16.25% | $4.25m |
| MORPHO | C · Positive but mixed or mild | +51.35% | −1.34% | +22.09% | +10.21 pp | −28.24% | $4.40m |
| JTO | E · 90-day and 30-day decline | −35.34% | −20.99% | +7.39% | −76.48 pp | −50.76% | $2.81m |
Which Meme coins had the strongest 90-day growth trend?
Meme has 13 eligible coin assignments in the June 26–September 24, 2026 window (1 A · 7 B · 4 C · 1 D · 0 E). MUBARAK had the highest 90-day endpoint return (+439.84%), while BONK had the lowest (−13.51%). These endpoints do not tell you the price path or future odds by themselves; compare the grade, recent 7/30-day direction, BTC-relative return and maximum daily-open drawdown in the table.
| Coin | 90d trend grade | 90d return | 30d return | 7d return | Vs BTC · 90d | 90d max drawdown | 30d median turnover |
|---|---|---|---|---|---|---|---|
| WIF | A · Strong aligned growth | +62.38% | +15.94% | +27.39% | +21.23 pp | −25.75% | $2.30m |
| MUBARAK | B · Positive, recently confirmed | +439.84% | +120.94% | +83.06% | +398.69 pp | −37.98% | $2.07m |
| PEPE | B · Positive, recently confirmed | +83.47% | +7.18% | +27.35% | +42.33 pp | −21.36% | $28.96m |
| TST | B · Positive, recently confirmed | +63.23% | +10.28% | +12.88% | +22.09 pp | −36.03% | $1.49m |
| GIGGLE | B · Positive, recently confirmed | +55.65% | +7.64% | +11.69% | +14.50 pp | −36.58% | $3.82m |
| SHIB | B · Positive, recently confirmed | +32.71% | +3.11% | +13.25% | −8.44 pp | −17.14% | $4.21m |
| DOGE | B · Positive, recently confirmed | +23.81% | +2.91% | +14.61% | −17.34 pp | −14.27% | $67.71m |
| FLOKI | B · Positive, recently confirmed | +23.52% | +1.30% | +15.22% | −17.63 pp | −20.05% | $1.84m |
| BOME | C · Positive but mixed or mild | +152.62% | −10.77% | +14.56% | +111.48 pp | −32.17% | $1.94m |
| PENGU | C · Positive but mixed or mild | +66.17% | −0.80% | +39.51% | +25.03 pp | −30.75% | $9.56m |
| NEIRO | C · Positive but mixed or mild | +41.20% | −4.86% | +8.03% | +0.06 pp | −24.58% | $1.49m |
| TRUMP | C · Positive but mixed or mild | +19.65% | −17.80% | +1.76% | −21.50 pp | −31.24% | $26.36m |
| BONK | D · Recent rebound inside 90-day loss | −13.51% | +9.66% | +31.84% | −54.66 pp | −55.02% | $3.55m |
Which AI coins had the strongest 90-day growth trend?
AI has 8 eligible coin assignments in the June 26–September 24, 2026 window (1 A · 1 B · 3 C · 2 D · 1 E). ZAMA had the highest 90-day endpoint return (+195.98%), while KAITO had the lowest (−28.93%). These endpoints do not tell you the price path or future odds by themselves; compare the grade, recent 7/30-day direction, BTC-relative return and maximum daily-open drawdown in the table.
| Coin | 90d trend grade | 90d return | 30d return | 7d return | Vs BTC · 90d | 90d max drawdown | 30d median turnover |
|---|---|---|---|---|---|---|---|
| ZAMA | A · Strong aligned growth | +195.98% | +53.85% | +91.91% | +154.84 pp | −33.33% | $3.57m |
| TAO | B · Positive, recently confirmed | +35.15% | +19.32% | +29.31% | −5.99 pp | −18.02% | $23.85m |
| VIRTUAL | C · Positive but mixed or mild | +33.10% | −11.99% | +16.05% | −8.05 pp | −26.26% | $4.33m |
| FET | C · Positive but mixed or mild | +15.19% | +11.74% | +22.85% | −25.95 pp | −35.36% | $11.00m |
| RENDER | C · Positive but mixed or mild | +13.79% | +16.54% | +26.87% | −27.36 pp | −22.54% | $3.99m |
| WLD | D · Recent rebound inside 90-day loss | −18.11% | +0.79% | +9.04% | −59.26 pp | −39.57% | $22.81m |
| SAHARA | D · Recent rebound inside 90-day loss | −22.03% | +13.56% | +12.34% | −63.17 pp | −39.40% | $1.21m |
| KAITO | E · 90-day and 30-day decline | −28.93% | −4.15% | +10.93% | −70.08 pp | −77.75% | $1.61m |
Which RWA coins had the strongest 90-day growth trend?
RWA has 5 eligible coin assignments in the June 26–September 24, 2026 window (2 A · 2 B · 0 C · 1 D · 0 E). PENDLE had the highest 90-day endpoint return (+98.07%), while CFG had the lowest (−31.15%). These endpoints do not tell you the price path or future odds by themselves; compare the grade, recent 7/30-day direction, BTC-relative return and maximum daily-open drawdown in the table.
| Coin | 90d trend grade | 90d return | 30d return | 7d return | Vs BTC · 90d | 90d max drawdown | 30d median turnover |
|---|---|---|---|---|---|---|---|
| PENDLE | A · Strong aligned growth | +98.07% | +39.43% | +5.92% | +56.93 pp | −23.09% | $4.66m |
| PLUME | A · Strong aligned growth | +65.79% | +13.77% | +26.31% | +24.64 pp | −15.56% | $2.19m |
| SKY | B · Positive, recently confirmed | +35.71% | +2.55% | +22.13% | −5.44 pp | −21.83% | $1.47m |
| ONDO | B · Positive, recently confirmed | +31.32% | +8.07% | +18.73% | −9.83 pp | −22.21% | $12.29m |
| CFG | D · Recent rebound inside 90-day loss | −31.15% | +0.85% | +34.56% | −72.30 pp | −53.36% | $1.93m |
Which Gaming coins had the strongest 90-day growth trend?
Gaming has 5 eligible coin assignments in the June 26–September 24, 2026 window (1 A · 0 B · 2 C · 0 D · 2 E). SAGA had the highest 90-day endpoint return (+262.24%), while GALA had the lowest (−16.60%). These endpoints do not tell you the price path or future odds by themselves; compare the grade, recent 7/30-day direction, BTC-relative return and maximum daily-open drawdown in the table.
| Coin | 90d trend grade | 90d return | 30d return | 7d return | Vs BTC · 90d | 90d max drawdown | 30d median turnover |
|---|---|---|---|---|---|---|---|
| SAGA | A · Strong aligned growth | +262.24% | +218.75% | +141.68% | +221.10 pp | −23.30% | $1.58m |
| ACE | C · Positive but mixed or mild | +150.20% | −12.58% | +20.03% | +109.06 pp | −47.10% | $2.79m |
| AXS | C · Positive but mixed or mild | +1.08% | +6.60% | +11.42% | −40.07 pp | −22.33% | $1.07m |
| SAND | E · 90-day and 30-day decline | −14.24% | −5.35% | +16.66% | −55.39 pp | −34.65% | $1.11m |
| GALA | E · 90-day and 30-day decline | −16.60% | −1.19% | +16.76% | −57.75 pp | −44.33% | $1.80m |
Which DePIN coins had the strongest 90-day growth trend?
DePIN has 4 eligible coin assignments in the June 26–September 24, 2026 window (1 A · 1 B · 2 C · 0 D · 0 E). AR had the highest 90-day endpoint return (+135.89%), while RENDER had the lowest (+13.79%). These endpoints do not tell you the price path or future odds by themselves; compare the grade, recent 7/30-day direction, BTC-relative return and maximum daily-open drawdown in the table.
| Coin | 90d trend grade | 90d return | 30d return | 7d return | Vs BTC · 90d | 90d max drawdown | 30d median turnover |
|---|---|---|---|---|---|---|---|
| AR | A · Strong aligned growth | +135.89% | +86.12% | +68.96% | +94.74 pp | −18.81% | $2.67m |
| FIL | B · Positive, recently confirmed | +27.04% | +24.19% | +16.07% | −14.10 pp | −21.66% | $10.96m |
| 0G | C · Positive but mixed or mild | +15.80% | +48.16% | +29.76% | −25.34 pp | −43.21% | $1.74m |
| RENDER | C · Positive but mixed or mild | +13.79% | +16.54% | +26.87% | −27.36 pp | −22.54% | $3.99m |
Which DEX coins had the strongest 90-day growth trend?
DEX has 6 eligible coin assignments in the June 26–September 24, 2026 window (3 A · 1 B · 2 C · 0 D · 0 E). RAY had the highest 90-day endpoint return (+233.85%), while DODO had the lowest (+5.97%). These endpoints do not tell you the price path or future odds by themselves; compare the grade, recent 7/30-day direction, BTC-relative return and maximum daily-open drawdown in the table.
| Coin | 90d trend grade | 90d return | 30d return | 7d return | Vs BTC · 90d | 90d max drawdown | 30d median turnover |
|---|---|---|---|---|---|---|---|
| RAY | A · Strong aligned growth | +233.85% | +157.94% | +42.21% | +192.70 pp | −26.13% | $7.30m |
| UNI | A · Strong aligned growth | +220.24% | +113.39% | +37.71% | +179.09 pp | −27.78% | $67.32m |
| CAKE | A · Strong aligned growth | +94.31% | +45.26% | +10.87% | +53.16 pp | −6.93% | $7.57m |
| ORCA | B · Positive, recently confirmed | +38.07% | +17.37% | +16.48% | −3.07 pp | −18.89% | $1.02m |
| ASTER | C · Positive but mixed or mild | +11.41% | −0.70% | −1.27% | −29.73 pp | −13.60% | $11.18m |
| DODO | C · Positive but mixed or mild | +5.97% | −6.99% | +1.97% | −35.18 pp | −36.57% | $1.69m |
Which Oracle & Data coins had the strongest 90-day growth trend?
Oracle & Data has 3 eligible coin assignments in the June 26–September 24, 2026 window (1 A · 1 B · 0 C · 0 D · 1 E). PYTH had the highest 90-day endpoint return (+93.09%), while KAITO had the lowest (−28.93%). These endpoints do not tell you the price path or future odds by themselves; compare the grade, recent 7/30-day direction, BTC-relative return and maximum daily-open drawdown in the table.
| Coin | 90d trend grade | 90d return | 30d return | 7d return | Vs BTC · 90d | 90d max drawdown | 30d median turnover |
|---|---|---|---|---|---|---|---|
| PYTH | A · Strong aligned growth | +93.09% | +25.63% | +18.54% | +51.94 pp | −24.50% | $3.07m |
| LINK | B · Positive, recently confirmed | +70.47% | +6.25% | +11.74% | +29.33 pp | −17.73% | $30.52m |
| KAITO | E · 90-day and 30-day decline | −28.93% | −4.15% | +10.93% | −70.08 pp | −77.75% | $1.61m |
Which Privacy coins had the strongest 90-day growth trend?
Privacy has 4 eligible coin assignments in the June 26–September 24, 2026 window (4 A · 0 B · 0 C · 0 D · 0 E). ZEC had the highest 90-day endpoint return (+259.53%), while DASH had the lowest (+69.38%). These endpoints do not tell you the price path or future odds by themselves; compare the grade, recent 7/30-day direction, BTC-relative return and maximum daily-open drawdown in the table.
| Coin | 90d trend grade | 90d return | 30d return | 7d return | Vs BTC · 90d | 90d max drawdown | 30d median turnover |
|---|---|---|---|---|---|---|---|
| ZEC | A · Strong aligned growth | +259.53% | +80.38% | +12.00% | +218.38 pp | −19.77% | $290.98m |
| ZAMA | A · Strong aligned growth | +195.98% | +53.85% | +91.91% | +154.84 pp | −33.33% | $3.57m |
| ZEN | A · Strong aligned growth | +76.06% | +32.53% | +5.88% | +34.91 pp | −17.03% | $6.51m |
| DASH | A · Strong aligned growth | +69.38% | +38.44% | +2.67% | +28.24 pp | −29.26% | $18.71m |
Which Payments coins had the strongest 90-day growth trend?
Payments has 7 eligible coin assignments in the June 26–September 24, 2026 window (3 A · 2 B · 2 C · 0 D · 0 E). VET had the highest 90-day endpoint return (+97.42%), while XLM had the lowest (+12.97%). These endpoints do not tell you the price path or future odds by themselves; compare the grade, recent 7/30-day direction, BTC-relative return and maximum daily-open drawdown in the table.
| Coin | 90d trend grade | 90d return | 30d return | 7d return | Vs BTC · 90d | 90d max drawdown | 30d median turnover |
|---|---|---|---|---|---|---|---|
| VET | A · Strong aligned growth | +97.42% | +55.35% | +22.58% | +56.27 pp | −12.31% | $2.00m |
| BCH | A · Strong aligned growth | +74.73% | +24.55% | +52.53% | +33.58 pp | −24.85% | $10.07m |
| LTC | A · Strong aligned growth | +51.15% | +19.75% | +19.63% | +10.00 pp | −9.84% | $18.32m |
| XRP | B · Positive, recently confirmed | +43.83% | +1.30% | +15.50% | +2.68 pp | −15.60% | $210.41m |
| ALGO | B · Positive, recently confirmed | +22.85% | +13.62% | +17.32% | −18.30 pp | −14.93% | $2.46m |
| COTI | C · Positive but mixed or mild | +96.45% | +33.71% | −3.65% | +55.31 pp | −43.87% | $4.31m |
| XLM | C · Positive but mixed or mild | +12.97% | +4.34% | +9.84% | −28.18 pp | −25.05% | $15.06m |
Which Interoperability coins had the strongest 90-day growth trend?
Interoperability has 6 eligible coin assignments in the June 26–September 24, 2026 window (1 A · 2 B · 3 C · 0 D · 0 E). ZRO had the highest 90-day endpoint return (+83.60%), while BICO had the lowest (+3.70%). These endpoints do not tell you the price path or future odds by themselves; compare the grade, recent 7/30-day direction, BTC-relative return and maximum daily-open drawdown in the table.
| Coin | 90d trend grade | 90d return | 30d return | 7d return | Vs BTC · 90d | 90d max drawdown | 30d median turnover |
|---|---|---|---|---|---|---|---|
| ZRO | A · Strong aligned growth | +83.60% | +37.61% | +51.06% | +42.45 pp | −29.60% | $6.36m |
| LINK | B · Positive, recently confirmed | +70.47% | +6.25% | +11.74% | +29.33 pp | −17.73% | $30.52m |
| DOT | B · Positive, recently confirmed | +30.72% | +22.58% | +8.04% | −10.42 pp | −24.24% | $9.55m |
| POL | C · Positive but mixed or mild | +40.35% | −12.99% | +4.63% | −0.79 pp | −26.40% | $7.41m |
| ATOM | C · Positive but mixed or mild | +5.21% | +11.42% | +11.50% | −35.94 pp | −24.12% | $2.36m |
| BICO | C · Positive but mixed or mild | +3.70% | +15.83% | +14.30% | −37.45 pp | −73.05% | $1.91m |
Which Stablecoin Infrastructure coins had the strongest 90-day growth trend?
Stablecoin Infrastructure has 5 eligible coin assignments in the June 26–September 24, 2026 window (1 A · 2 B · 1 C · 0 D · 1 E). ENA had the highest 90-day endpoint return (+150.00%), while WLFI had the lowest (−7.02%). These endpoints do not tell you the price path or future odds by themselves; compare the grade, recent 7/30-day direction, BTC-relative return and maximum daily-open drawdown in the table.
| Coin | 90d trend grade | 90d return | 30d return | 7d return | Vs BTC · 90d | 90d max drawdown | 30d median turnover |
|---|---|---|---|---|---|---|---|
| ENA | A · Strong aligned growth | +150.00% | +34.91% | +38.44% | +108.85 pp | −22.76% | $39.73m |
| SKY | B · Positive, recently confirmed | +35.71% | +2.55% | +22.13% | −5.44 pp | −21.83% | $1.47m |
| ONDO | B · Positive, recently confirmed | +31.32% | +8.07% | +18.73% | −9.83 pp | −22.21% | $12.29m |
| SPK | C · Positive but mixed or mild | +14.19% | +6.06% | +11.06% | −26.95 pp | −28.61% | $1.22m |
| WLFI | E · 90-day and 30-day decline | −7.02% | −5.57% | −6.54% | −48.17 pp | −13.64% | $5.64m |
How were the crypto sectors, coins and liquidity threshold chosen?
Before calculating returns, we chose 14 parent categories that answer common retail tasks: base chains, scaling, DeFi, Meme, AI, RWA, gaming, decentralized infrastructure, DEX, oracle/data, privacy, payments, interoperability and stablecoin infrastructure. This is a deliberate subset of CoinNudge's 50-theme live taxonomy, because many of the other 36 baskets are subthemes or ecosystem overlays that would double-count the same names. It is not a claim that the other 36 themes have no value. The taxonomy version and all members of each selected category are frozen in the downloadable JSON.
Every member of those 14 baskets entered the candidate ledger before return calculation: 281 sector assignments covering 235 unique symbols. A row qualifies only if it has all 91 Binance USDT daily opens from June 26 through September 24 and at least $1m median daily quote turnover over the final 30 daily bars. Of 281 assignments, 131 lacked a complete or valid path and 43 missed the turnover floor; 107 assignments covering 86 unique coins remained. A coin may appear twice because, for example, a DEX token can also be DeFi. We never add assignment counts as if they were independent assets.
This gate is a research trade-off, not a definition of the best investments. It improves comparability and avoids claiming a thin market is easily tradable, but it excludes young winners, off-Binance assets and historical failures absent from the present taxonomy. Turnover measures completed trade value, not spread or depth, and cannot guarantee a fill. The article's title describes categories; it does not promise a comprehensive list of every cryptocurrency worldwide.
| Coverage gate | Count | What it means |
|---|---|---|
| Selected parent categories | 14 of 50 | Transparent thematic scope, not all market themes |
| Candidate assignments / distinct symbols | 281 / 235 | Every listed taxonomy member enters before price screening |
| No complete valid 90-day daily-open path | 131 assignments | Missing/new/off-venue paths remain excluded, not zero |
| Below $1m median daily quote turnover | 43 assignments | Trading-value gate; not order-book depth |
| Included assignments / distinct coins | 107 / 86 | Overlapping category membership is disclosed |
| BTC comparison | +41.15% | Same dates, same venue and USDT quote |
Verify: Candidate and exclusion ledger · Binance Spot candle fields
What should you check about a sector coin besides its price?
A sector label describes a problem or narrative; it does not establish what holders own. For Layer 1, compare user fees, validator economics, developer activity and future issuance. For Layer 2, separate rollup usage from the governance token's rights. For DeFi/DEX, ask whether protocol fees reach tokenholders or merely support a product. For RWA, distinguish the tokenized claim from a platform or governance token. For AI and DePIN, verify paying demand, token settlement and subsidy dependence. For Meme, value often depends especially on attention, distribution and liquidity rather than an enforceable claim on revenue.
The order of work is identity → token rights → supply and future float → real product usage → venue liquidity → historical market behavior. We measure only the final market layer here. We do not label 86 different issuers as fundamentally sound because they cleared a volume screen. If fundamentals or token rights are unavailable, mark them unknown instead of assuming a strong price chart proves them.
Supply and project fundamentals can overturn the chart. A token that outperformed BTC yet has a large scheduled unlock, concentrated owners or weak executable depth may present a very different risk from another member in the same category. Likewise, a short-term loser may have a useful product; a 90-day relative return is not a fundamental valuation.
| Sector question | Evidence to request | Common shortcut to reject |
|---|---|---|
| Meme | Holder distribution, verified contract, liquidity and attention durability | Price spike = safe social consensus |
| AI / DePIN | Paying workload, token flow, rewards and emissions | AI label = token cash flow |
| RWA / stablecoin infrastructure | Legal rights, reserves or receivables, redemption and token distinction | Governance token = claim on assets |
| DeFi / DEX | Protocol usage, fee routing, token rights and exploits | Total value locked = tokenholder earnings |
| Layer 1 / Layer 2 | Fees, users, security budget, issuance and bridge risk | Network growth = guaranteed token return |
Verify: CoinNudge token supply guide · Current sector heatmap
Where did the sector narrative fail in this historical window?
Meme's group median conceals a −13.51% BONK return and −55.02% maximum drawdown while MUBARAK rose +439.84%. A basket headline dominated by the biggest winner would overstate what a typical included coin experienced. The median avoids that single-winner distortion but still hides path risk and cannot model an equal-weight portfolio without rebalancing and trading costs.
AI provides the opposite failure case: eight qualified assignments had a +14.49% median 90-day return, but only one beat BTC. An AI story may be commercially important without its traded token outperforming the benchmark. Gaming's median was just +1.08% even though SAGA was its best included member; the 'best coin' and 'sector' question are different.
A liquidity counterexample is MUBARAK: its +439.84% price return occurred with about $2.07m median daily quote turnover, far below DOGE's $67.71m. Price return and capacity do not scale together. These are current-taxonomy historical survivors; we did not recreate what a trader could have known about the full coin universe on June 26.
Verify: Full observations with BTC-relative returns and drawdowns
How should you use a crypto sector list to build a research shortlist?
First choose the question: which sector is attracting broad demand, which token captures value, or which market has tolerable execution risk? For current participation, open the live 50-theme heatmap and check eligible counts and breadth. For historical context, use this fixed 14-category release: scan the A–E grade distribution, then compare every included coin's 7/30/90-day return, BTC-relative result, drawdown and turnover. A token with strong 90-day performance but negative recent 30-day performance deserves a different explanation from one improving across all windows.
Second compare two or more members inside the same mechanism, not just the highest-return ticker. Check drawdown, trailing turnover and current depth; then review token economics and supply in original project disclosures. If a claim cannot be independently checked, record it as unknown. Third set a monitoring question: if volume expands while sector breadth and BTC-relative strength also improve, an alert can prompt research. It is not an automatic order or an estimate of future return.
If a beginner asks 'which sector should I buy today?', the truthful answer is conditional: this report does not rank risk-adjusted future opportunities. Its most useful output is a shortlist and a list of disqualifying questions. The live heatmap answers what is moving now; the archived release answers how one dated market period differed.
Verify: Live 50-theme sector heatmap · Current market breadth and pressure · Crypto alert categories
Can these 90-day sector returns identify the next winning sector?
No. This is one shared 90-day market period with three nested endpoint windows, not three independent experiments. BTC itself gained +41.15%, so positive token returns are partly a market-regime result. Sector assignments overlap, present taxonomy membership is used retrospectively, and delisted or off-venue assets are absent. Neither a confidence interval based on 107 supposedly independent tokens nor a 'probability of winning' would be defensible from this release.
Median, 25th/75th percentile, positive count, BTC-beating count, A–E grade distribution and path drawdown are all published so a reader can see group dispersion and exceptions. The smaller three-to-five-member sectors are exploratory even when their medians look impressive. A stronger predictive test would freeze membership and liquidity before each start, observe many non-overlapping future periods and include exchange/venue changes and costs. This release does not pretend to be that test.
Daily-open drawdown omits intraday lows, and quote turnover omits spreads, order-book depth, deposits, withdrawals and venue outages. Archived bars were collected or backfilled later; they are not evidence that CoinNudge observed the same complete dataset in June. Those limits are important whenever someone proposes turning this table into an investable sector rotation strategy.
Verify: Full protocol and coverage audit · Point-in-time data boundaries
How can you reproduce every sector coin's 90-day trend grade?
Download the frozen study JSON, 107-row observation CSV, 281-row candidate ledger, 14-row summary and all 91 daily source rows for each included coin. Its public Python verifier recomputes 7/30/90-day open-to-open returns, maximum daily-open drawdown, 30-day median USDT quote turnover, BTC-relative percentage points, counts and sector medians. The separate grade release copies the frozen observations as its exact input and publishes all 107 A–E grades in JSON and CSV. Its second Python verifier recalculates every letter under the ordered rules, checks the raw values and row order, and verifies file SHA-256. Neither verifier needs a private CoinNudge service.
The candidate ledger uses 'missing_or_invalid_daily_open' or 'below_median_quote_turnover_floor'; missing is never a zero return. The taxonomy is frozen by version, and the input rows retain observed and ingested timestamps. In this release 242 of 7,917 included daily rows lacked a local upstream-file hash. We independently retrieved the corresponding Binance public daily ZIP for each and matched all 242 open prices and quote volumes within published floating-point tolerances; the full per-row cross-check is downloadable. That verifies these values against those public files, but does not retroactively create missing original-ingest metadata or validate token fundamentals. A future refresh must create a new immutable release.
| Public file | What it proves | Important boundary |
|---|---|---|
| sector-research.json | Protocol, taxonomy, audit, member and sector results | Dated historical release |
| sector-observations.csv | 107 included assignments; 86 unique symbols | Overlapping baskets |
| sector-candidates.csv | All 281 candidates and exclusion reasons | CoinNudge taxonomy only |
| daily-inputs.csv | 91 daily prices and volumes per included coin | Retrospective archive, not historical PIT selection |
| grades.csv + grades.json | Every sector member's A–E grade and full numeric path | Descriptive historical trend, not a buy rating |
| reproduce.py + manifest.json | Independent study and grade arithmetic plus SHA-256 integrity | Not issuer or trade execution verification |
Verify: Study JSON · Candidate ledger · Observations · Daily inputs · Recent-source cross-check · Reproduce this release · File manifest · All 107 graded rows · Grade calculation and counts · Independent grade verifier
Take the next step with this evidence.
Choose ongoing Telegram monitoring or inspect structured data in your own research workflow.
Receive qualifying events in Telegram.
Use the ready-made alert checklist, message explanations and daily briefing. Check the supported categories and coins before subscribing; every Research page is not a separate alert category.
Check the alert list · View alert plans
Inspect the data before choosing a pack.
Prepared research packs supply scoped features, separate outcomes where available and quality flags. Buy a fixed edition once and download directly; API use is optional.
Check data pack samples · Explore the full data catalog · Compare data plans
Each purchased pack includes its specified fields and published date range. This page's full dataset is not automatically included. Other data families require coverage, date, field and source-use confirmation before purchase. Telegram Pro is a separate 30-day service; historical packs are one-time purchases.
Frequently asked questions
Which crypto coins are in the Meme sector?
Thirteen Meme members qualified in this dated Binance spot comparison: BOME, BONK, DOGE, FLOKI, GIGGLE, MUBARAK, NEIRO, PENGU, PEPE, SHIB, TRUMP, TST and WIF. The other taxonomy candidates and exclusion reasons are published.
Which representative crypto coins should I research in each sector?
The page lists all eligible members and a dated research-starting list for all 14 sectors. For example, ETH and SOL anchor Layer 1 turnover; ARB and POL anchor Layer 2; UNI and ENA anchor DeFi; DOGE and PEPE anchor Meme; TAO and WLD anchor AI; ONDO and PENDLE anchor RWA. The list compares liquidity and contrasting historical paths, not future buy opportunities.
How did CoinNudge choose the representative sector coins?
For each sector, the two highest 30-day median quote-turnover coins are liquidity anchors. A third coin is the strongest positive 30-day return among the remainder with a 90-day daily-open drawdown no worse than 40%, if available. The final comparison has the lowest 90-day return among those left. All names and inputs come from the frozen September 24, 2026 observations; token fundamentals and current execution remain separate checks.
Which crypto sector performed best in this study?
Privacy had the highest 90-day median among these 14 categories (+136.02%) but only four eligible members. This is a retrospective descriptive median, not an investable sector-index return or future ranking.
Did Meme coins beat Bitcoin?
Eight of 13 eligible Meme assignments beat BTC's +41.15% return in the same 90-day period. The group median was +55.65%, but the median maximum daily-open drawdown was −30.75%. Overlapping tokens and one period do not estimate future odds.
Why are only 86 distinct coins included if the candidate pool has 235?
A member needs all 91 daily Binance USDT opens and at least $1m median daily quote turnover in the final 30 days. The 281 sector assignments include overlaps; 131 assignments lack a complete valid path and 43 miss the turnover floor.
Are these the best crypto coins to buy now?
No. A representative research list is not a buy rating: historical return and sector category alone cannot establish token rights, valuation, current depth or future performance. Use the report as a dated research universe and review current market and fundamentals separately.
Why does the live heatmap have 50 sectors but this report has 14?
The heatmap tracks 50 overlapping live themes. This retrospective report chooses 14 broad parent questions and publishes every member of those baskets under one common 90-day gate, avoiding excessive subtheme double counting.
What do the 7-day, 30-day and 90-day numbers mean?
They are price changes between daily Binance USDT opens ending September 24, 2026. The windows overlap; they are sensitivity views of one period, not separate independent trials.
Can I backtest a sector-rotation strategy from this file?
Not without historical point-in-time membership, liquidity at each selection date, missing/delisted assets and execution costs. This release uses current editorial taxonomy and retrospective archived bars.
How often is the sector coin list updated?
This is a frozen September 26, 2026 release. Future updates must use a new release version. For current sector participation use the live 50-theme heatmap.
What does an A, B, C, D or E 90-day crypto coin grade mean?
A describes at least +50% over 90 days with +10% or more over 30 days, a positive 7 days and no worse than −35% daily-open drawdown. B requires at least +20% over 90 days and positive 30/7 days. C is a nonnegative 90-day result without A/B confirmation. D is a negative 90 days with a positive 30-day rebound. E is negative over 90 days and nonpositive over 30 days. These are historical price-path labels, not investment-quality or buy recommendations.
Why can a coin with a large 90-day gain receive only a C grade?
The ordered A/B rules also require recent positive 30-day and 7-day direction, and A limits daily-open drawdown. A token can finish far above its 90-day starting price but lose momentum in the most recent month; the separate columns show that conflict.
Does an A grade mean I should buy that sector coin now?
No. The grades use one completed historical window ending September 24, 2026, not current price, token fundamentals, valuation, execution costs or forward returns. Current liquidity, token supply and risk must be checked separately.
Sources and verification
- CoinNudge sector studyFrozen taxonomy, eligibility, coverage audit and results.
- CoinNudge included member observationsAll 107 included sector assignments with returns, drawdowns and turnover for the representative list.
- CoinNudge 90-day sector trend gradesThe 107 A–E grades, ordered thresholds, raw metrics and per-sector counts.
- CoinNudge candidate ledgerAll included and excluded category assignments.
- Binance Spot market-data documentationOfficial daily-candle price and quote-volume field definitions.
- Binance daily-file cross-checkAll 242 release rows missing local source hashes were matched to official daily ZIPs.
See which themes have broad participation now.
Compare the live 50-theme heatmap with the dated evidence here; do not treat the strongest historical sector as tomorrow's winner.
Explore live sector evidence