Tokenomics evidence guide · By CoinNudge Research · · Guide updated 2026-10-03 · 14 min read
FDV vs market cap: what do token supply and unlocks tell you?
FDV vs market cap compares different supply denominators at one price; it does not predict an unlock-related price drop. In the September 26, 2026 CoinGecko snapshot, reported circulating supply was 40.97% of maximum for SUI, 41.47% for APT and 67.30% for ENA. Those ratios are not release dates, executable valuations or sale forecasts. Use this guide to distinguish unit price, valuation, future transfer eligibility and actual sell pressure before drawing a tokenomics conclusion.
Download the comparison · Check 180-day calendar
How do FDV and market cap reveal different crypto supply questions?
- Use the same price timestamp and supply provider: circulating cap = price × circulating supply; this edition's FDV = price × reported maximum supply.
- The float ratio compares two provider fields. A low ratio is a prompt to investigate recipient and timing, not a price-drop probability.
- Do not add scheduled gross releases and call the total new market float or expected exchange selling.
Does a low crypto price mean a low valuation?
No. A token’s unit price must be multiplied by its defined supply before valuation comparisons become meaningful. Hypothetically, one trillion units at $0.001 imply $1 billion under that denominator; one million units at $100 imply $100 million. Neither calculation measures token rights, cash flow or executable sale proceeds.
The table retains September 26, 2026 CoinGecko prices and both supply denominators for APT, ENA and SUI; October 3 updates the explanation, not those observations. Compare price alongside circulating capitalization and this edition’s maximum-denominator FDV. Use full-precision inputs for arithmetic, not rounded float percentages.
A missing or disputed maximum is unknown, not zero. Do not combine another provider’s supply field with this provider’s price without stating the changed definition and time. A cheap-looking unit can coexist with a large supply valuation and weak holder rights.
| September 26 snapshot | Unit price USD | Reported circulating units | Reported maximum units | Circulating cap | Price × maximum FDV |
|---|---|---|---|---|---|
| APT | $0.860686 | 870,803,154 | 2,100,000,000 | $749,488,083.53 | $1,807,440,600.00 |
| ENA | $0.270181 | 10,095,312,500 | 15,000,000,000 | $2,727,561,626.56 | $4,052,715,000.00 |
| SUI | $1.170000 | 4,096,537,147 | 10,000,000,000 | $4,792,948,461.45 | $11,700,000,000.00 |
What is the simplest hypothetical dilution calculation?
For a clearly defined supply and value scenario, price ratio equals aggregate-value ratio divided by tradable-supply ratio. If the relevant supply rises 10% while aggregate value is constant, price becomes 1/1.10 of the prior price: a 9.09% decline, not 10%. If both rise 10%, price is unchanged. The table is arithmetic, not an observed unlock experiment.
Choose the supply variable before calculating. Vesting eligibility, escrow release, provider-reported circulation and tokens on an exchange are different quantities. A treasury transfer does not establish selling; an expected release may affect price before its date. The scenario is useful for checking assumptions, not estimating the amount recipients will sell or the size of the eventual price move.
An APT, SUI or ENA application therefore needs its own beneficiary, schedule, transfer and demand evidence. The three frozen valuation rows cannot provide a common “unlock causes this return” coefficient; project activity also does not automatically create cash flow to token holders.
| Explicit hypothetical scenario | Supply factor | Value / demand proxy factor | Implied price change |
|---|---|---|---|
| No new float | 1.00 | 1.00 | 0.00% |
| 10% more tradable supply | 1.10 | 1.00 | −9.09% |
| Supply and value both +10% | 1.10 | 1.10 | 0.00% |
| Supply +10%, value −10% | 1.10 | 0.90 | −18.18% |
Which token-unlock facts should you verify before a holding decision?
Verify the exact token, beneficiary, transfer restriction, dated release window and source confidence before comparing a potential release with float or turnover. Those ratios prioritize the size of the question; current depth and actual transfer/sale evidence are still needed to discuss execution or sell pressure.
Do not give “high FDV” or “high current float” a universal buy/sell grade. Demand growth can coexist with high FDV, and concentrated holders or weak rights can coexist with high float. Preserve the dated snapshot and separate three clocks: provider valuation, planned release and observed trading. If a critical source disagrees, resolve the definition before using a precise ratio.
Verify: Distinguish vesting, escrow and circulation in the unlock calendar · Inspect current crypto buying and selling pressure
What do the SUI, APT and ENA FDV examples actually show?
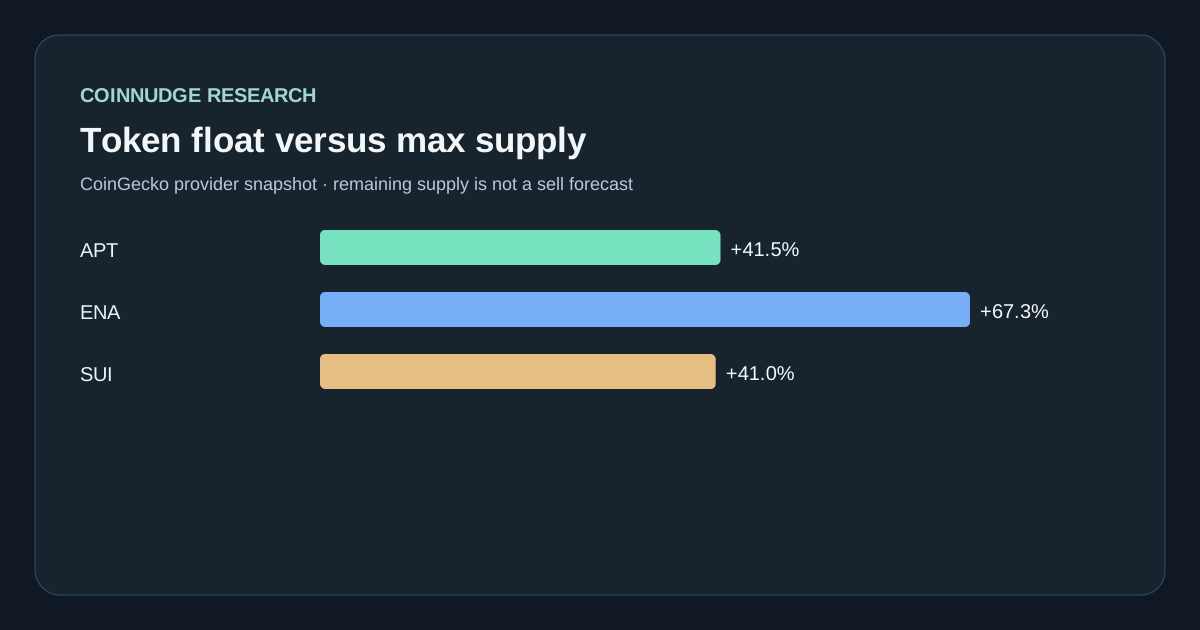
The recorded CoinGecko values imply SUI's $1.17 price × 4.0965 billion circulating units ≈ $4.793 billion circulating market cap, versus $1.17 × 10 billion maximum units = $11.70 billion FDV. APT's reported float ratio was 41.47%; ENA's was 67.30%. Their different prices, token rights and liquidity mean the float ratio cannot rank them as investments by itself.
A maximum-minus-circulating number is not a dated unlock. It may include allocations with different conditions, already-unlocked holdings outside the provider's circulation classification, or supply definitions that can change. The right next question is: which specific class becomes transferable, under which rule, and how large is that class relative to actual market liquidity?
| Token · 2026-09-26 provider snapshot | Price USD | Circulating / max | Float ratio | Circulating cap | FDV |
|---|---|---|---|---|---|
| SUI | $1.1700 | 4.097bn / 10.000bn | 40.97% | $4.79bn | $11.70bn |
| APT | $0.860686 | 0.871bn / 2.100bn | 41.47% | $0.75bn | $1.81bn |
| ENA | $0.270181 | 10.095bn / 15.000bn | 67.30% | $2.73bn | $4.05bn |
Verify: Public row-level calculations · CoinGecko market-data field definitions
How do you calculate FDV, market cap and the float ratio consistently?
Use one named price and supplier definition: circulating market cap = price × circulating units; this edition’s FDV = the same price × reported maximum units; float ratio = circulating/maximum. These are consistent arithmetic comparisons, not independent estimates of intrinsic value or the amount sellable at that price.
SUI’s frozen $1.17 × 10 billion reported maximum gives $11.7 billion FDV, whereas its circulating denominator gives about $4.793 billion. The table’s legacy ‘Unreleased-to-current-float’ label means only (maximum − circulating)/circulating: it does not verify that those units are locked, unreleased or about to be sold. Other suppliers can use a different diluted base; inspect the field definition before comparing their labels.
| Metric | Formula in this edition | What it does not prove |
|---|---|---|
| Circulating market cap | snapshot price × reported circulating units | True free float or available order-book depth |
| FDV | same price × reported maximum units | Future market price or realized sale proceeds |
| Float ratio | circulating ÷ maximum × 100% | Next-180-day release or expected selling |
| Unreleased-to-current-float | (maximum − circulating) ÷ circulating | A scheduled issuance or dilution event |
Do token unlocks dilute holders or automatically make price fall?
A contractual or administrative unlock may make previously restricted tokens transferable. The effect on tradable float depends on whether those units were already counted as circulating, who receives them, whether they move, and whether buyers absorb the supply. Price also changes with demand and wider market conditions; the unlock date is not a deterministic sell signal.
The site's 180-day calendar distinguishes dated plans from broad interval forecasts and from events with no confirmed token amount. XRP escrow eligibility, SUI projected circulation and contributor vesting are different mechanisms. Do not sum gross XRP escrow eligibility as new issuance, and do not turn SUI's monthly circulation projection into an exact-day exchange sale.
Verify: CoinNudge 180-day unlock calendar · Sui Foundation supply schedule
How do the SUI, APT and ENA denominator gaps differ from scheduled unlocks?
The SUI, APT and ENA supply gaps are comparable arithmetic stocks under the same frozen September 26, 2026 CoinGecko definition—not comparable scheduled unlocks. Maximum minus circulating counts units outside that provider field; it does not establish whether they are locked, already transferable, held by an issuer or about to be sold. The ratio to reported current circulation sizes a verification question, not next-month supply flow.
The issuer mechanisms differ: Sui publishes projected circulating supply, Aptos documents allocation vesting and staking emissions, and Ethena describes contributor and ecosystem allocations. Later Aptos proposals do not become enacted rules merely because a provider maximum field exists. For a specific holding question, check the current governing schedule, beneficiary, restriction and actual transfers; do not interpret these three stocks as three identical 180-day releases or as measured selling pressure.
| Coin | Reported max − circulating | As % of reported circulating | Issuer mechanism to investigate | Not measured here |
|---|---|---|---|---|
| APT | 1.229bn | 141.16% | Allocation vesting plus staking emissions | Next release date, actual float added or sale |
| ENA | 4.905bn | 48.58% | Contributor vesting and ecosystem allocations | Next release date, actual float added or sale |
| SUI | 5.903bn | 144.11% | Projected circulation and allocation releases | Next release date, actual float added or sale |
Verify: Frozen three-coin supplier fields and arithmetic · Sui official supply schedule · Aptos official tokenomics overview · Aptos later tokenomics update; check proposal status · Ethena official ENA allocation and vesting
How sensitive is the dilution scenario to demand and supply assumptions?
Changing the aggregate-value assumption changes the answer as much as changing supply. In the hypothetical +25% supply table, unchanged value gives −20% price, value +25% gives unchanged price, and value +50% gives +20% price. These sensitivities show why a supply calendar alone cannot forecast returns.
The identity is price = circulating market value/circulating units; the price-change ratio is (new value/old value)/(new units/old units) − 1. It does not establish a causal relationship between an unlock and investor demand. Provider circulation may not equal exchange-available float, recipients may hold, and quoted depth can be much smaller than headline capitalization.
The September 26 provider-defined maximum-minus-circulating stock was 144.11% of current circulating units for SUI, 141.16% for APT and 48.58% for ENA. Those theoretical stocks are not amounts scheduled over the next 180 days. Compare specific official tranches with actual market conditions; recipient selling remains unobserved here.
| Hypothetical change in circulating units | Hypothetical change in circulating market value | Arithmetic token-price change | Interpretation |
|---|---|---|---|
| +25% | −10% | −28% | Value falls while units rise |
| +25% | 0% | −20% | Constant value is not constant price |
| +25% | +25% | 0% | Value growth exactly matches units |
| +25% | +50% | +20% | Value growth exceeds units |
| Unknown | Unknown | Not estimated | A real unlock needs actual float and demand evidence |
Verify: Dated supply inputs and ratios · Planned unlock events with source links
Does a higher circulating percentage make one crypto coin safer than another?
No. A float percentage becomes informative only alongside the beneficiary schedule, ownership, token rights and executable liquidity. A slow dispersed release and a concentrated near-term team cliff can have the same provider float ratio but represent different research questions.
In the frozen three-token snapshot, APT and SUI have similar float ratios yet different capitalization and supply mechanisms; ENA’s larger ratio does not establish lower risk or a better return. Use the table to identify missing evidence in each project rather than rank them solely by FDV. No absorption probability or real-sale impact is estimated by this dataset.
| Question before buying | Evidence needed | If unknown |
|---|---|---|
| Which units become transferable? | Issuer allocation and enforceable vesting rule | Do not invent an unlock amount |
| Who receives them? | Beneficiary class and concentration | Do not infer a sale from eligibility |
| Could the market absorb sales? | Current order-book depth and turnover | Do not use market cap as liquidity |
| Does the token capture product activity? | Fees, staking need or enforceable rights | Do not use project TVL as holder income |
Verify: Official Sui supply forecast · CoinNudge market liquidity research
What if max supply, market cap and FDV are missing or disagree?
Keep unavailable fields missing and reconcile definitions before producing a ratio. Check the asset identifier, observation time, currency, price source and whether “diluted supply” means maximum, total or an estimate. Recomputing a provider’s displayed valuation with a different denominator can create an apparent error that is really a definition mismatch.
If the token has no credible finite maximum, this edition’s price-times-maximum comparison cannot be applied without a separately named assumption. If supply or the governing schedule conflicts across sources, retain both dated versions and mark the field unresolved. Do not replace the unknown with zero, select whichever FDV looks cheaper or present a provider revision as an actual sale.
Verify: CoinGecko price and supply field definitions · Frozen CoinGecko source rows used in this comparison
What is the exact supply data method and its limitation?
The case freezes one September 26 CoinGecko /coins/markets response for SUI, APT and ENA. We compute the formulas above from its current_price, circulating_supply and max_supply fields without filling nulls or changing provider. The original provider response, computed JSON, row-level CSV, code contract and SHA-256 manifest are available. Price and supply are a single provider snapshot, not a time-series performance test; there is no confidence interval or causal unlock result to claim.
The three assets were chosen to demonstrate differing float ratios and official-document follow-up, not sampled to estimate what proportion of crypto is low-float. Vendor classifications can differ, official plans change, and an exact circulation census may not be independently available. Re-query source timestamps before using any number after this publication date.
Verify: Frozen source response · Recalculated JSON · Row-level CSV · Release file hashes
How do you turn FDV research into a verifiable tokenomics review?
Create a dated review that separates valuation stock, planned transfer eligibility, observed distribution and executable liquidity. The output should say what is verified, what is only an issuer/provider statement and what remains unknown; it should not turn a single FDV number into an entry signal.
For each unresolved supply question, name the official schedule, deployed restriction or market observation needed next. Recheck when the issuer revises its plan or actual transfers appear, retaining the original snapshot. The 180-day calendar can locate planned events; it neither establishes that they execute nor proves the recipients sell.
Take the next step with this evidence.
Choose ongoing Telegram monitoring or inspect structured data in your own research workflow.
Receive qualifying events in Telegram.
Use the ready-made alert checklist, message explanations and daily briefing. Check the supported categories and coins before subscribing; every Research page is not a separate alert category.
Check the alert list · View alert plans
Inspect the data before choosing a pack.
Prepared research packs supply scoped features, separate outcomes where available and quality flags. Buy a fixed edition once and download directly; API use is optional.
Check data pack samples · Explore the full data catalog · Compare data plans
Each purchased pack includes its specified fields and published date range. This page's full dataset is not automatically included. Other data families require coverage, date, field and source-use confirmation before purchase. Telegram Pro is a separate 30-day service; historical packs are one-time purchases.
Frequently asked questions
What is the difference between FDV and circulating market cap?
This page calculates FDV from CoinGecko's reported maximum supply and circulating cap from its reported circulating supply at one snapshot price. Other providers may use a different fully diluted base; neither figure is guaranteed proceeds.
Is low float and high FDV always bad?
No. It signals a need to inspect release timing, recipients, token demand and liquidity. A low ratio alone is not a return prediction.
Will an unlock make a crypto token fall?
Not necessarily. Transfer eligibility, actual transfers, sales and market impact are separate events; demand and market conditions can offset or dominate potential selling.
How much SUI is circulating in this example?
The frozen CoinGecko response at 2026-09-26 04:27 UTC reported about 4.097 billion circulating SUI of 10 billion maximum, or 40.97%. It is a provider estimate and may change.
Is maximum supply minus circulating supply the next unlock?
No. The difference is a broad provider-defined stock of noncirculating units, not a scheduled next release, 180-day flow or expected sale.
Where can I check upcoming token unlocks?
Use the CoinNudge 180-day calendar for planned events and linked official schedules, then verify execution and recipient movement separately.
If supply rises 25%, does the token price have to fall 20%?
Only in a hypothetical model where circulating market value stays unchanged and all new units are counted the same way: 1/1.25 − 1 = −20%. Real market value, actual tradable float and demand can change, so this is not an unlock-price forecast.
Do SUI, APT and ENA have the same kind of future supply risk?
No. CoinGecko's maximum-minus-circulating arithmetic is comparable as a provider-defined stock, but Sui projected circulation, Aptos allocation vesting and staking emissions, and Ethena contributor/ecosystem allocations have different rules. Verify current official schedules, proposal status, recipient and actual market transfers separately.
Does a low crypto price mean it is undervalued?
No. The unit price needs a supply denominator and a valuation/value-capture argument. Our table puts price, circulating capitalization and maximum-denominator FDV side by side.
Does 10% supply growth imply a 10% price fall?
No. Under constant aggregate value the arithmetic change is 1/1.10−1, or −9.09%. Real outcomes also depend on demand, tradable supply, ownership, liquidity and expectations.
Should FDV and circulating market cap use the same price?
Yes for this comparison: both multiply the same snapshot price by different named supply denominators. Mixing dates or providers without disclosure can make the apparent valuation gap misleading.
What if a token has no reliable maximum supply?
Leave the maximum-based FDV unavailable or state a separately justified diluted-base assumption. Do not fill missing supply with zero or silently substitute another provider’s denominator.
Sources and verification
- CoinGecko markets API documentationProvider definitions for price and supply fields.
- Frozen CoinGecko responseExactly the three provider rows used here.
- Recomputed comparison JSONFormulas, results, version and hashes.
- Sui Foundation supply scheduleOfficial planned circulation and allocation context, not verified sale activity.
- Aptos official tokenomics and later updateAllocation and emissions context; proposed changes must not be treated as enacted without verification.
- Ethena official ENA launch and vestingIssuer-described allocations and vesting, not a current exchange-sale record.
- Supply-metric definitionsAlternative definitions show why an FDV denominator must be named; this page uses CoinGecko's maximum field.
- October 2 explanatory evidence editionOriginal experiments preserved; normalized accounting, snapshots and new-study input hashes.
- October 2 readable chart editionChart file hashes and bindings to unchanged frozen numerical evidence.
- Independent October 2 arithmetic auditSeparate arithmetic, checksums and replay diagnostics; not certification of future results.
See planned releases and their evidence boundaries.
Use the scheduled unlock calendar as a starting point; verify whether a dated event actually executes.
Check upcoming unlocks