Monthly candidate research · By CoinNudge Research · · Guide updated 2026-09-17 · 18 min read
Top 10 Cryptocurrencies to Consider Buying Now
September 2026 answer: BNB, AR, ENA lead our rules-based shortlist. 20 of 103 data-and-liquidity-eligible Binance USDT spot markets pass the score and risk gates; the highest-ranked 10 are shown—not automatic buys. The cutoff is 2026-09-17T00:00:00Z; scores use a 90-day price window and 30-day valid executed-buy data. In 26 completed historical monthly baskets, the median 30-day return after an assumed 0.20% round-trip cost was +2.29%; 14/26 were positive and 15/26 beat BTC. That is not evidence of a reliably profitable strategy. Use this as a shortlist for further research, not a personalized buy order or a prediction of this month’s winners. The headline ratings are within-pool percentiles, not absolute model scores: a 9.9/10 relative rating is not a 99% chance of profit.
Preview alert list · Explore research data · See alert plans
Key points
- 10 shown from 20 qualifying names in a 103-market eligible pool; all directory exclusions are public.
- The 90-day scoring context is distinct from 7/30/90-day forward outcome tests.
- Headline stars measure same-edition relative standing; raw scores and absolute qualification gates remain visible. Neither score is a profit probability.
- Historical performance is mixed and conditioned on today’s survivor pool; no robust alpha claim.
- Public downloads preserve every score and failed or incomplete historical month.
How we screen Binance spot markets for the Top 10
The screening process begins with Binance’s official exchangeInfo directory: 1372 active spot pairs representing 494 distinct base assets. Each base asset is checked for market eligibility before scoring.
After asset classification, 398 native-crypto USDT markets are checked individually. 103 pass the continuous 91-day history, valid buy fields and sustained-turnover rules: 30-day median daily quote turnover ≥1 million USDT, 7-day median ≥1 million USDT, and at least 24 of the last 30 days with turnover ≥500,000 USDT. There is no top-N truncation before scoring.
To avoid counting the same coin repeatedly, measurements use one active USDT pair per base asset. Stable-value, leveraged and identified non-crypto products are excluded. Assets with only other quote pairs are explicitly reported as out of measurement scope, not silently claimed as covered. This is a Binance spot screen, not a whole-world asset ranking.
Directory/classification were retrieved for this release (2026-09-17T13:02:37.667361+00:00); candle calculations end at 2026-09-17T00:00:00Z. The directory is not a reconstructed historical constituent list. Previous releases remain downloadable for audit purposes.
This revision replaces the former 5-million-USDT admission cutoff, not the raw scoring weights. New-coin and sudden-volume watchlists are separate research questions and are not included in this mature-market ranking.
| Coverage stage / final exclusion reason | Count |
|---|---|
| Active spot trading pairs | 1372 |
| Distinct active base assets | 494 |
| Native-crypto USDT markets individually scanned | 398 |
| eligible_for_scoring | 103 |
| excluded_asset_class | 96 |
| insufficient_sustained_turnover | 25 |
| median_daily_quote_below_research_threshold | 266 |
| missing_or_invalid_91_day_price_window | 4 |
| Pass current score and risk gates | 20 |
| Published top-ranked candidates | 10 |
Verify: Every asset and exclusion · All screened 91-day inputs · Frozen Binance directory · Official product-classification snapshot · Superseded first release
Top 10 mature-market candidates: relative standing and original evidence
20 markets pass the absolute score and risk gates; the top 10 are shown. Stars compare each coin with all 103 data-and-liquidity-eligible scored markets, including those that fail the final risk gates—not just the ten shown.
Relative rating = 10 × number of peers with a strictly lower raw model score / N. Exact ties receive equal ratings; raw score, then symbol, orders the table. Display rounds to one decimal. It measures relative position in this edition, not safety, return or profit probability. A strong rank in a weak market can still lose money.
The original model score must still be at least 6.0, price above SMA30, 30-day return positive and 90-day closing drawdown no more than 40%. A relative rating never overrides these gates. Raw model scores remain beside the stars. “Wait” flags weak active buying or extended price.
| Rank | Crypto / spot pair | Relative rating · NOT profit odds | 30d / 90d price return | Raw model score · stance |
|---|---|---|---|---|
| 1 | BNB · BNBUSDT | +19.83% / +25.49% | Raw 7.3/10 · Research candidate, not an entry order | |
| 2 | AR · ARUSDT | +40.08% / +24.23% | Raw 7.2/10 · Research candidate, not an entry order | |
| 3 | ENA · ENAUSDT | +78.97% / +55.59% | Raw 7.2/10 · Wait for buying/price confirmation | |
| 4 | UNI · UNIUSDT | +104.26% / +109.16% | Raw 7.2/10 · Wait for buying/price confirmation | |
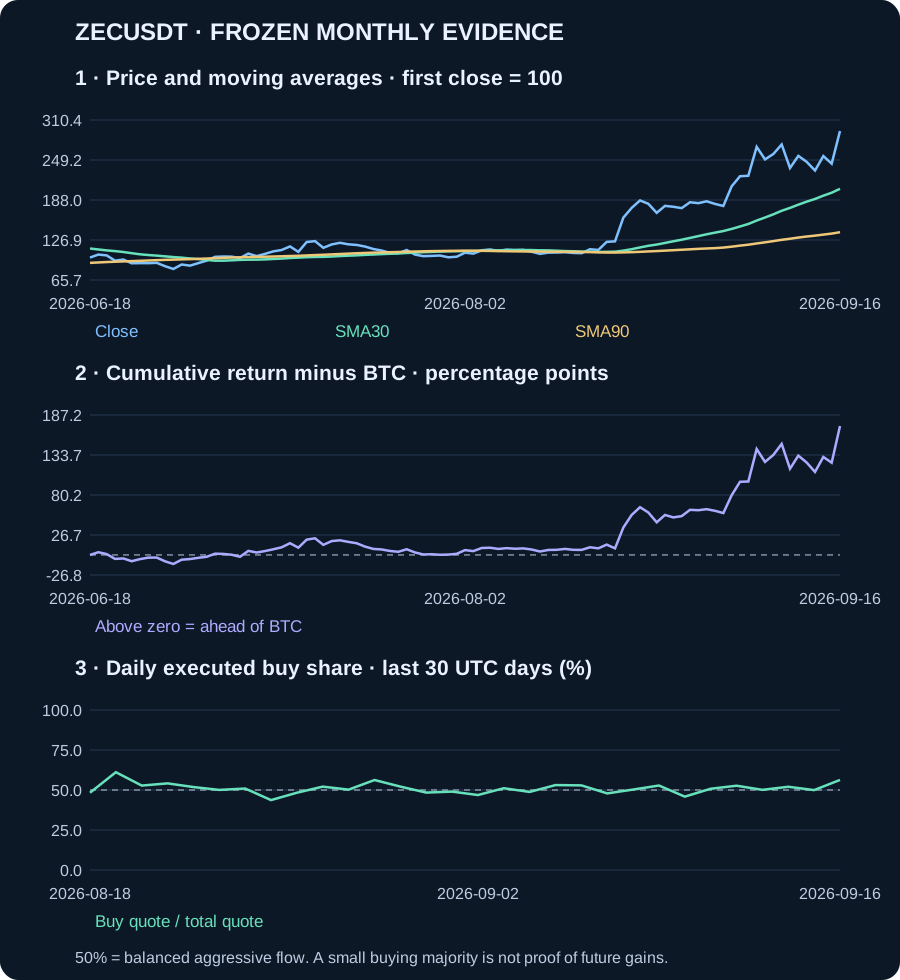
| 5 | ZEC · ZECUSDT | +160.25% / +193.50% | Raw 7.1/10 · Wait for buying/price confirmation | |
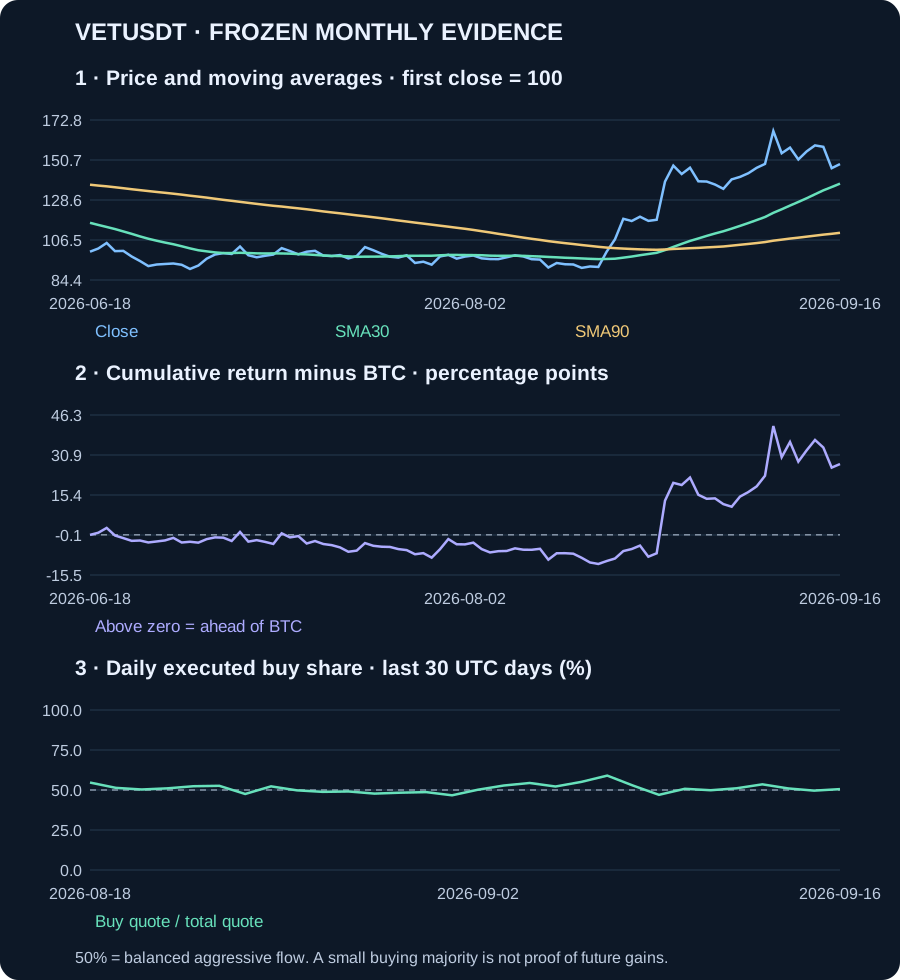
| 6 | VET · VETUSDT | +61.60% / +48.41% | Raw 7.0/10 · Research candidate, not an entry order | |
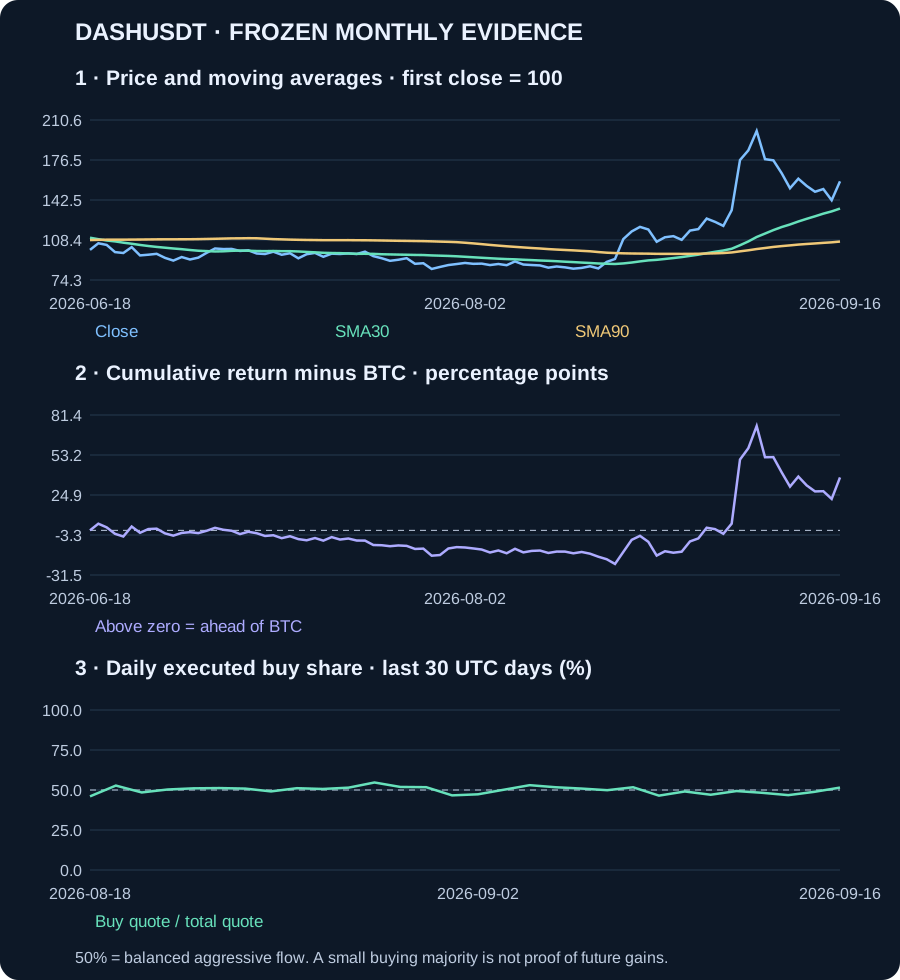
| 7 | DASH · DASHUSDT | +84.09% / +58.38% | Raw 6.9/10 · Wait for buying/price confirmation | |
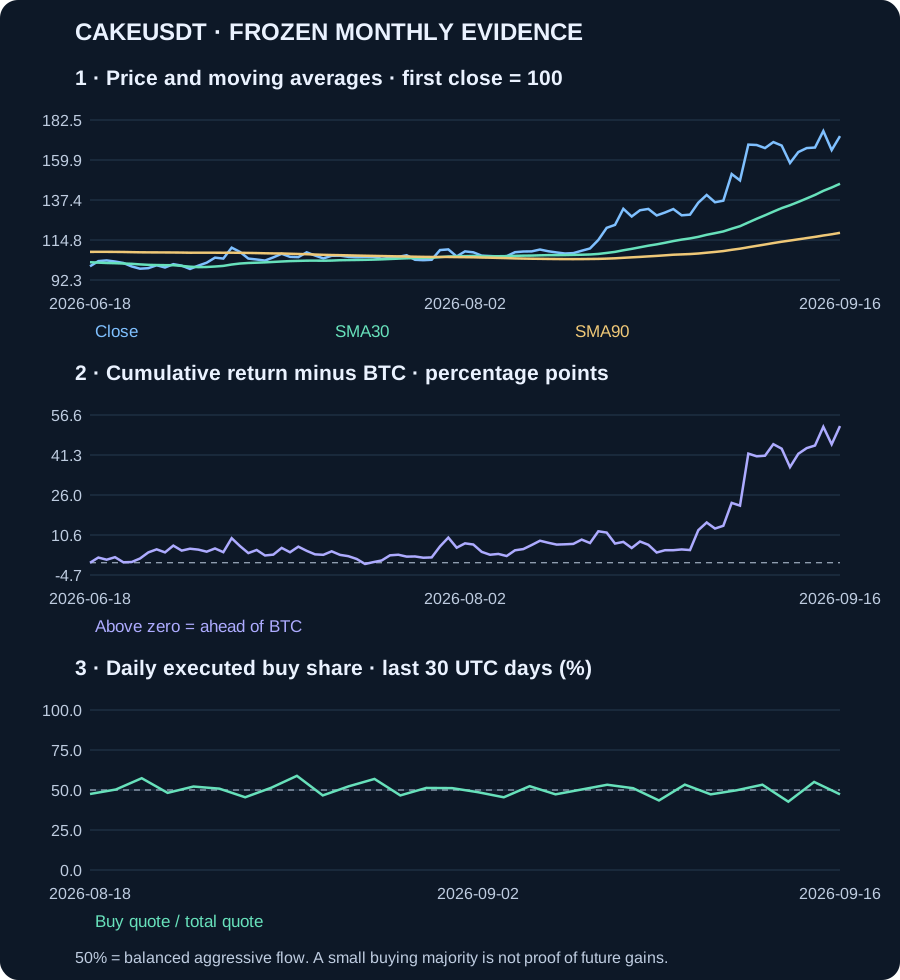
| 8 | CAKE · CAKEUSDT | +57.57% / +73.42% | Raw 6.9/10 · Wait for buying/price confirmation | |
| 9 | NEAR · NEARUSDT | +60.01% / +17.17% | Raw 6.8/10 · Wait for buying/price confirmation | |
| 10 | STX · STXUSDT | +100.50% / +31.39% | Raw 6.6/10 · Research candidate, not an entry order |
What did the historical experiment actually find?
The 30-day average basket return was +0.37% and the median was +2.29%. The average advantage over BTC was -0.43%; its descriptive 95% block-bootstrap interval is -8.82% to +6.95%. A small average difference is not a robust investment edge.
Longer holding was not automatically safer: the 90-day median was -2.19% across 24 completed baskets. Only 10 were positive. Monthly 90-day windows overlap, so these are not independent trials.
These are retrospective simulations on today’s retained universe, not returns earned by subscribers. The model was specified in September 2026, not deployed in 2024. Survivor selection, missing historical fields and testing several dimensions limit generalization. No historical period here is advertised as an untouched holdout.
| Holding horizon | Complete baskets | Median net reference return | Mean net / descriptive 95% interval | Positive / beat BTC |
|---|---|---|---|---|
| 7 days | 27 | +1.05% | +0.87% · -3.54% to +5.98% | 15 / 17 |
| 30 days | 26 | +2.29% | +0.37% · -7.65% to +7.84% | 14 / 15 |
| 90 days | 24 | -2.19% | +5.44% · -9.66% to +22.14% | 10 / 9 |
Why broaden liquidity eligibility—and which names depend on the cutoff?
The earlier 5m daily-median gate excluded steady smaller markets before their trend and risk were evaluated. The revised 1m/1m/24-day policy admits sustained activity without treating a single volume spike as sufficient. Lower turnover still earns a lower raw liquidity component; below 5m that component remains zero.
The table compares 1m, 2m and 5m 30-day medians while keeping the same recent-activity conditions and scoring rules. AR, VET and STX enter this edition; PROM, AVAX and LTC still qualify but rank below ten. At 2m VET is excluded and ZEN enters: borderline membership is not robust to every reasonable cutoff.
This is threshold sensitivity, not evidence that 1m maximizes future returns. Parameters have not been validated on an untouched future sample. Current turnover is not executable capacity; order-book observations below are supplementary, not historical inputs.
| 30d median floor | Scored markets | Pass risk/score gates | Top ten |
|---|---|---|---|
| 1m USDT | 103 | 20 | BNB, AR, ENA, UNI, ZEC, VET, DASH, CAKE, NEAR, STX |
| 2m USDT | 81 | 18 | BNB, AR, ENA, UNI, ZEC, DASH, CAKE, NEAR, STX, ZEN |
| 5m USDT | 45 | 12 | BNB, ENA, UNI, ZEC, DASH, CAKE, NEAR, PROM, AVAX, LTC |
Two different scores: peer standing and fixed model fit
Method monthly-candidates-1.1-sustained-percentile. The five original component formulas and weights below are unchanged. The raw weighted sum minus the extension deduction determines ordering and the 6.0 qualification gate. The new headline relative rating is derived only afterward, over all 103 scoreable peers: 10 × strictly-lower-score count / 103. It does not change who passes or boost the raw model score.
Trend and relative strength overlap economically. They are disclosed as related dimensions, not two independent confirmations. Flow is executed aggressive buy quote volume divided by total quote volume—not exchange deposits, new money entering crypto or proof that buyers will stay.
All returns below are fractions, not percentage points. clip(x)=min(1,max(0,x)); I(condition)=1 when true and 0 otherwise. C is the final closed daily price. SMA30/SMA90 are arithmetic closing-price averages. R30/R90 compare C with the close 30/90 calendar days earlier. BTC uses identical dates.
Example: BNB has raw model score 7.2754, above 102 of 103 scored markets; its relative rating is 10 × 102/103 = 9.9029, displayed as 9.9/10. Ties are not artificially separated. N<2 produces no relative rating. Ratings are not directly comparable between editions with different peer pools.
To reproduce this version, call sustained_score(symbol, daily_series, btc_series, cutoff_epoch_seconds−86400) from scoring.py, then relative_ratings over all successful results before applying the final score/risk gate. The legacy score() default still describes the superseded 5m policy; calling it alone does not reproduce this edition.
| Factor | Weight | Exact component formula |
|---|---|---|
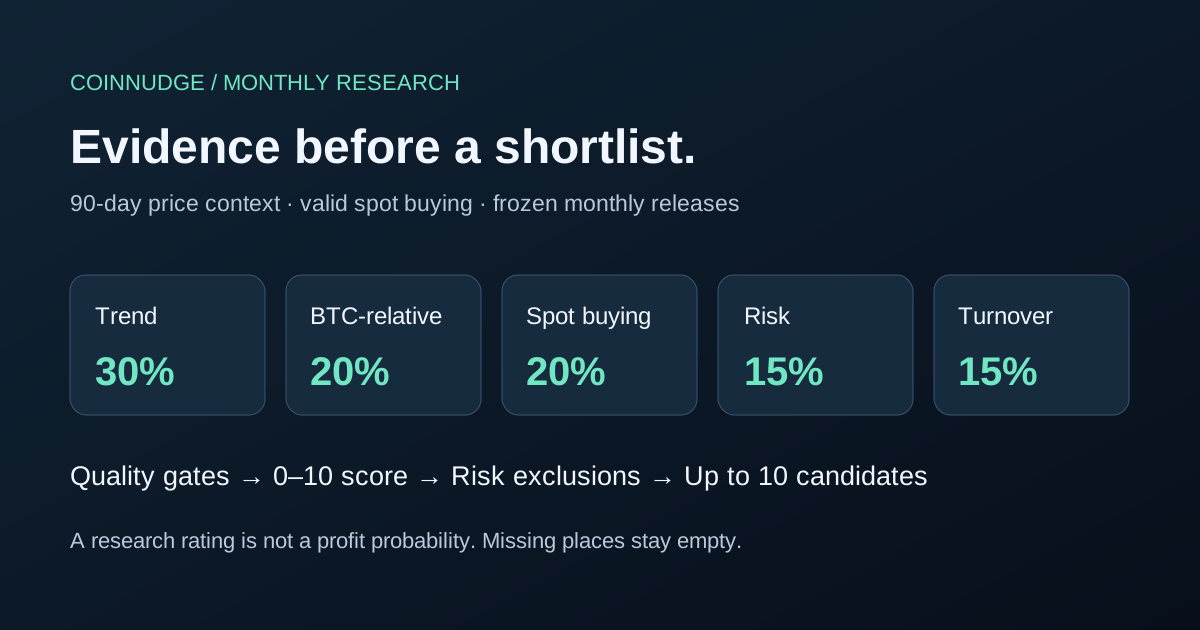
| Trend | 30% | 10 × [0.4 I(C>SMA30) + 0.3 I(SMA30>SMA90) + 0.3 clip(0.5+R90/0.6)] |
| Relative strength vs BTC | 20% | 10 × clip(0.5 + (R30−BTC_R30)/0.4) |
| Executed spot buying | 20% | 10 × clip(0.5 + (sum(taker_buy_quote30)/sum(quote30)−0.5)/0.1) |
| Downside / volatility | 15% | 10 × [0.5 clip(1−MDD90/0.5) + 0.5 clip(1−annualizedVol90/1.5)] |
| Turnover capacity proxy | 15% | 10 × clip(log10(medianDailyQuote30 / 5,000,000) / 2) |
| Extension deduction | 0–1 point | min(1, max(0, C/SMA30−1−0.15)/0.25) |
Verify: Download scoring implementation · Download all component scores
Which coins were eligible—and why are Bitcoin or Solana not guaranteed a place?
Start at the official active Binance spot directory, deduplicate base assets and exclude non-target asset classes. Require 91 consecutive valid daily closes and 30-day median daily quote turnover ≥1 million USDT, 7-day median ≥1 million USDT, and at least 24 of the last 30 days with turnover ≥500,000 USDT. Every passing market is scored. These operational cutoffs are disclosed judgment calls, not proven optimal investment parameters.
The public input file contains 86,397 daily bars across the 103 current eligible pool members, starting at 2023-11-01T00:00:00Z. That earliest date is not shared coverage: each market starts at its own available date, and the historical exclusion ledger records gaps.
The 91 closing prices provide exactly 90 one-day returns. An otherwise eligible market requires 30/30 valid active-buy fields to be scored. A zero-volume day, missing candle, impossible OHLC ordering or invalid active-buy amount is not interpreted as a bearish reading.
A formal candidate requires an unrounded score of at least 6.0, price above SMA30, a positive 30-day return and a 90-day close-to-close maximum drawdown no greater than 40%. Sort qualifying markets and retain at most ten. These thresholds are judgment-based screening rules, not empirically proven optimum thresholds.
BTC and ETH receive exactly the same screening rules as other coins. Being omitted means this particular momentum-and-risk screen did not select them; it does not mean they are fundamentally inferior, should be sold, or cannot outperform.
| Scored market | Raw model score (not relative stars) | Selected / reason not selected |
|---|---|---|
| BNB | 7.3 / 10 | Selected |
| AR | 7.2 / 10 | Selected |
| ENA | 7.2 / 10 | Selected |
| UNI | 7.2 / 10 | Selected |
| ZEC | 7.1 / 10 | Selected |
| VET | 7.0 / 10 | Selected |
| DASH | 6.9 / 10 | Selected |
| CAKE | 6.9 / 10 | Selected |
| SOL | 6.9 / 10 | close_not_above_sma30 |
| NEAR | 6.8 / 10 | Selected |
| ETH | 6.8 / 10 | close_not_above_sma30 |
| STX | 6.6 / 10 | Selected |
| ZEN | 6.6 / 10 | Outside top ten |
| PENDLE | 6.5 / 10 | Outside top ten |
| PROM | 6.5 / 10 | Outside top ten |
| AVAX | 6.4 / 10 | Outside top ten |
| BTC | 6.4 / 10 | close_not_above_sma30 |
| WBETH | 6.3 / 10 | close_not_above_sma30 |
| JST | 6.3 / 10 | Outside top ten |
| PYTH | 6.2 / 10 | Outside top ten |
| XRP | 6.2 / 10 | close_not_above_sma30 |
| MINA | 6.2 / 10 | Outside top ten |
| LTC | 6.1 / 10 | Outside top ten |
| INJ | 6.1 / 10 | Outside top ten |
| DOT | 6.1 / 10 | Outside top ten |
| MUBARAK | 6.0 / 10 | score_below_6 |
| ARB | 6.0 / 10 | score_below_6 |
| ORDI | 5.9 / 10 | score_below_6 |
| PUMP | 5.8 / 10 | score_below_6, close_not_above_sma30 |
| AAVE | 5.8 / 10 | score_below_6, close_not_above_sma30 |
| ASTER | 5.8 / 10 | score_below_6 |
| FF | 5.7 / 10 | score_below_6 |
| RAY | 5.7 / 10 | score_below_6 |
| RUNE | 5.7 / 10 | score_below_6 |
| COTI | 5.7 / 10 | score_below_6, 90d_close_drawdown_above_40pct |
| PEPE | 5.7 / 10 | score_below_6, close_not_above_sma30 |
| WBTC | 5.6 / 10 | score_below_6, close_not_above_sma30 |
| LA | 5.6 / 10 | score_below_6, 90d_close_drawdown_above_40pct |
| FIL | 5.5 / 10 | score_below_6 |
| TRUMP | 5.5 / 10 | score_below_6, close_not_above_sma30 |
| ICP | 5.4 / 10 | score_below_6 |
| POL | 5.4 / 10 | score_below_6, close_not_above_sma30 |
| XLM | 5.3 / 10 | score_below_6 |
| CRV | 5.3 / 10 | score_below_6, close_not_above_sma30 |
| LINK | 5.2 / 10 | score_below_6, close_not_above_sma30 |
| WIF | 5.1 / 10 | score_below_6, close_not_above_sma30 |
| DOGE | 5.0 / 10 | score_below_6, close_not_above_sma30 |
| MET | 4.7 / 10 | score_below_6, close_not_above_sma30 |
| TRX | 4.7 / 10 | score_below_6, close_not_above_sma30 |
| ADA | 4.7 / 10 | score_below_6, close_not_above_sma30 |
| NEIRO | 4.7 / 10 | score_below_6, close_not_above_sma30 |
| ETHFI | 4.6 / 10 | score_below_6, close_not_above_sma30 |
| BCH | 4.6 / 10 | score_below_6, close_not_above_sma30 |
| CHIP | 4.5 / 10 | score_below_6, close_not_above_sma30, 90d_close_drawdown_above_40pct |
| LDO | 4.5 / 10 | score_below_6, close_not_above_sma30 |
| ZRO | 4.4 / 10 | score_below_6, close_not_above_sma30 |
| SUI | 4.4 / 10 | score_below_6, close_not_above_sma30 |
| ZAMA | 4.4 / 10 | score_below_6, close_not_above_sma30 |
| ETC | 4.3 / 10 | score_below_6, close_not_above_sma30 |
| TAO | 4.3 / 10 | score_below_6, close_not_above_sma30 |
| PENGU | 4.3 / 10 | score_below_6, close_not_above_sma30 |
| HBAR | 4.2 / 10 | score_below_6, close_not_above_sma30 |
| WLFI | 4.1 / 10 | score_below_6, 30d_return_not_positive |
| FLOKI | 4.0 / 10 | score_below_6, close_not_above_sma30 |
| ALGO | 4.0 / 10 | score_below_6, close_not_above_sma30 |
| FET | 4.0 / 10 | score_below_6, close_not_above_sma30 |
| CHZ | 3.8 / 10 | score_below_6, 90d_close_drawdown_above_40pct |
| OP | 3.8 / 10 | score_below_6, close_not_above_sma30 |
| SKY | 3.7 / 10 | score_below_6, close_not_above_sma30 |
| SHIB | 3.7 / 10 | score_below_6, close_not_above_sma30 |
| MORPHO | 3.7 / 10 | score_below_6, close_not_above_sma30, 30d_return_not_positive |
| STRK | 3.6 / 10 | score_below_6 |
| FORM | 3.5 / 10 | score_below_6, close_not_above_sma30 |
| PLUME | 3.5 / 10 | score_below_6, close_not_above_sma30 |
| ONDO | 3.5 / 10 | score_below_6, close_not_above_sma30 |
| ATOM | 3.5 / 10 | score_below_6, close_not_above_sma30 |
| TIA | 3.4 / 10 | score_below_6, close_not_above_sma30 |
| XPL | 3.3 / 10 | score_below_6, close_not_above_sma30 |
| VIRTUAL | 3.2 / 10 | score_below_6, close_not_above_sma30 |
| WLD | 3.2 / 10 | score_below_6, close_not_above_sma30, 90d_close_drawdown_above_40pct |
| TUT | 3.0 / 10 | score_below_6, close_not_above_sma30, 30d_return_not_positive, 90d_close_drawdown_above_40pct |
| GIGGLE | 3.0 / 10 | score_below_6, close_not_above_sma30 |
| HEMI | 2.7 / 10 | score_below_6, close_not_above_sma30, 30d_return_not_positive, 90d_close_drawdown_above_40pct |
| ACE | 2.7 / 10 | score_below_6, close_not_above_sma30, 30d_return_not_positive, 90d_close_drawdown_above_40pct |
| APT | 2.6 / 10 | score_below_6, close_not_above_sma30 |
| DODO | 2.6 / 10 | score_below_6, close_not_above_sma30, 30d_return_not_positive |
| EIGEN | 2.3 / 10 | score_below_6, close_not_above_sma30, 90d_close_drawdown_above_40pct |
| RENDER | 2.2 / 10 | score_below_6, close_not_above_sma30 |
| LUNC | 2.0 / 10 | score_below_6, close_not_above_sma30 |
| SEI | 1.9 / 10 | score_below_6, close_not_above_sma30 |
| MEGA | 1.9 / 10 | score_below_6, close_not_above_sma30, 90d_close_drawdown_above_40pct |
| BONK | 1.9 / 10 | score_below_6, close_not_above_sma30, 90d_close_drawdown_above_40pct |
| RE | 1.8 / 10 | score_below_6, close_not_above_sma30, 90d_close_drawdown_above_40pct |
| CFG | 1.5 / 10 | score_below_6, close_not_above_sma30, 30d_return_not_positive, 90d_close_drawdown_above_40pct |
| 币安人生 | 1.4 / 10 | score_below_6, close_not_above_sma30, 90d_close_drawdown_above_40pct |
| GALA | 1.2 / 10 | score_below_6, close_not_above_sma30, 90d_close_drawdown_above_40pct |
| SAHARA | 1.1 / 10 | score_below_6, close_not_above_sma30, 90d_close_drawdown_above_40pct |
| BICO | 1.1 / 10 | score_below_6, close_not_above_sma30, 30d_return_not_positive, 90d_close_drawdown_above_40pct |
| JTO | 1.0 / 10 | score_below_6, close_not_above_sma30, 30d_return_not_positive, 90d_close_drawdown_above_40pct |
| HOLO | 1.0 / 10 | score_below_6, close_not_above_sma30 |
| BANK | 0.9 / 10 | score_below_6, close_not_above_sma30, 30d_return_not_positive, 90d_close_drawdown_above_40pct |
| KAITO | 0.8 / 10 | score_below_6, close_not_above_sma30, 30d_return_not_positive, 90d_close_drawdown_above_40pct |
| DEXE | 0.8 / 10 | score_below_6, close_not_above_sma30, 30d_return_not_positive, 90d_close_drawdown_above_40pct |
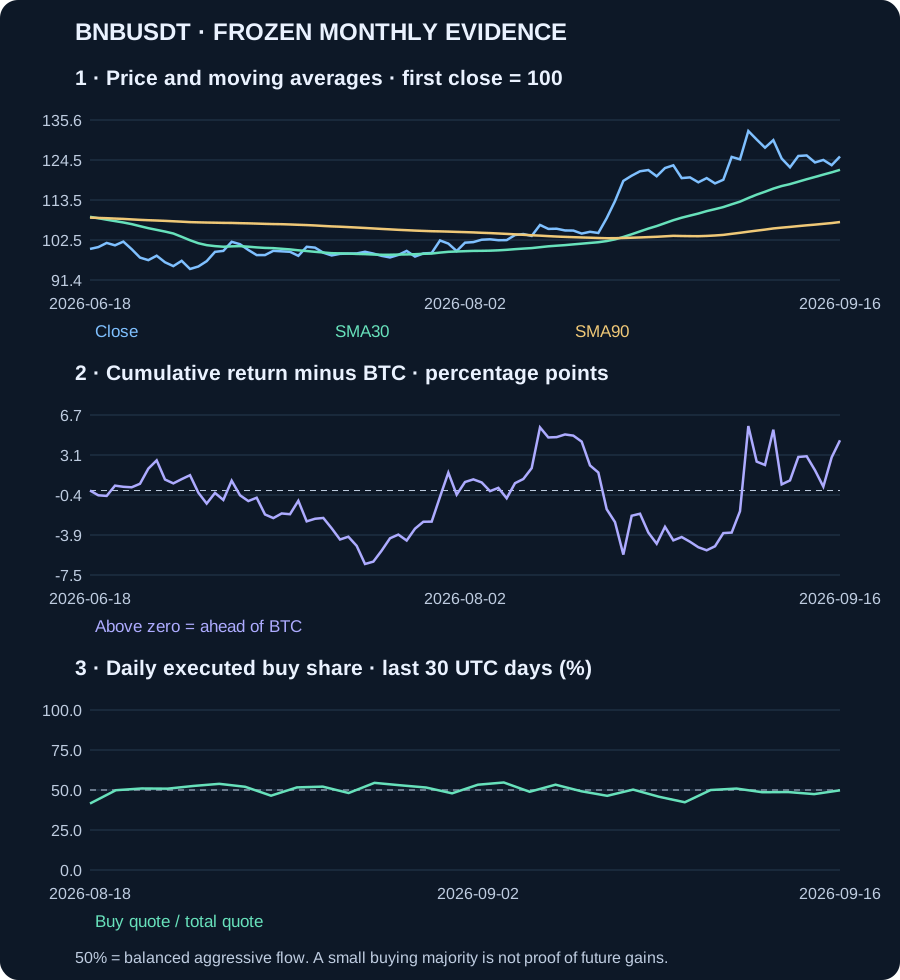
#1 BNB: Strong trend with contained historical drawdown

Same-edition relative rating: 9.9/10; original model score: 7.28/10. It outranks 102 of 103 scored peers. The reference close is 725.92 USDT, not a live quote. Its 30-day excess return versus BTC is +1.74 percentage points.
Why it leads: BNB combines positive trend alignment with a comparatively contained historical drawdown and substantially higher turnover than the smaller entrants. The edge is balanced model fit, not the largest recent gain; its active-buy majority is only slight.
Trend check: the reference close is +3.02% above SMA30 and +16.82% relative to SMA90. The 30-day buying share is +0.18 percentage points from the 50% balance line. The trend and aggregate executed-buy balance agree, but the buying margin is small. No extension deduction applies under this model; that alone does not make the entry safe.
Why it meets the mature-market screen: 30-day median quote turnover is 108,661,264 USDT; the 7-day median is 94,349,941 USDT, with 30/30 days above 500,000 USDT. These are activity measures, not a guarantee that a large order can be filled cheaply.
Execution-risk spot check (2026-09-17T13:18:23.975641+00:00, later than the scoring cutoff): bid/ask spread 0.14 basis points; observed buy-side/sell-side notional within 0.5% of mid is 388,929/371,097 USDT. Only the first 100 levels were captured; incomplete bands are lower bounds. This one snapshot does not establish typical depth, estimate a guaranteed fill, or enter the historical score.
Executed active buying accounts for 50.18% of quote turnover. Price is +3.02% from SMA30, producing a 0.00-point extension deduction. The observed 90-day close drawdown was 7.54% and annualized daily volatility was 33.82%. Neither is a ceiling on future losses.
This coin appeared in 9 historical selected baskets; 9 have a complete 30-day outcome. Their median cost-adjusted reference return was +4.77%, with 5/9 positive. These selected observations are sparse and conditioned on the current survivor universe; they are not a calibrated future win rate.
Weight sensitivity: removing one factor at a time and renormalizing the remaining weights moves its rank between 1 and 12 within the currently qualifying pool. This is a sensitivity range, not a confidence interval.
What would invalidate qualification: a future review finds price at or below its updated SMA30, a non-positive 30-day return, a score below 6, drawdown above 40%, or invalid required inputs. Current SMA30 is 704.65633 USDT; it moves with new data and is not a fixed stop-loss instruction. Before buying, separately verify project security, token supply events, custody and execution costs; this model has not cleared those risks.
| Trend | BTC-relative | Spot buying | Risk | Turnover |
|---|---|---|---|---|
| 9.77/10 | 5.43/10 | 5.18/10 | 8.12/10 | 6.69/10 |
Verify: Open full-size evidence chart · Download exact chart series · Verify original daily inputs
#2 AR: Buyer-led strength with a moderate historical drawdown

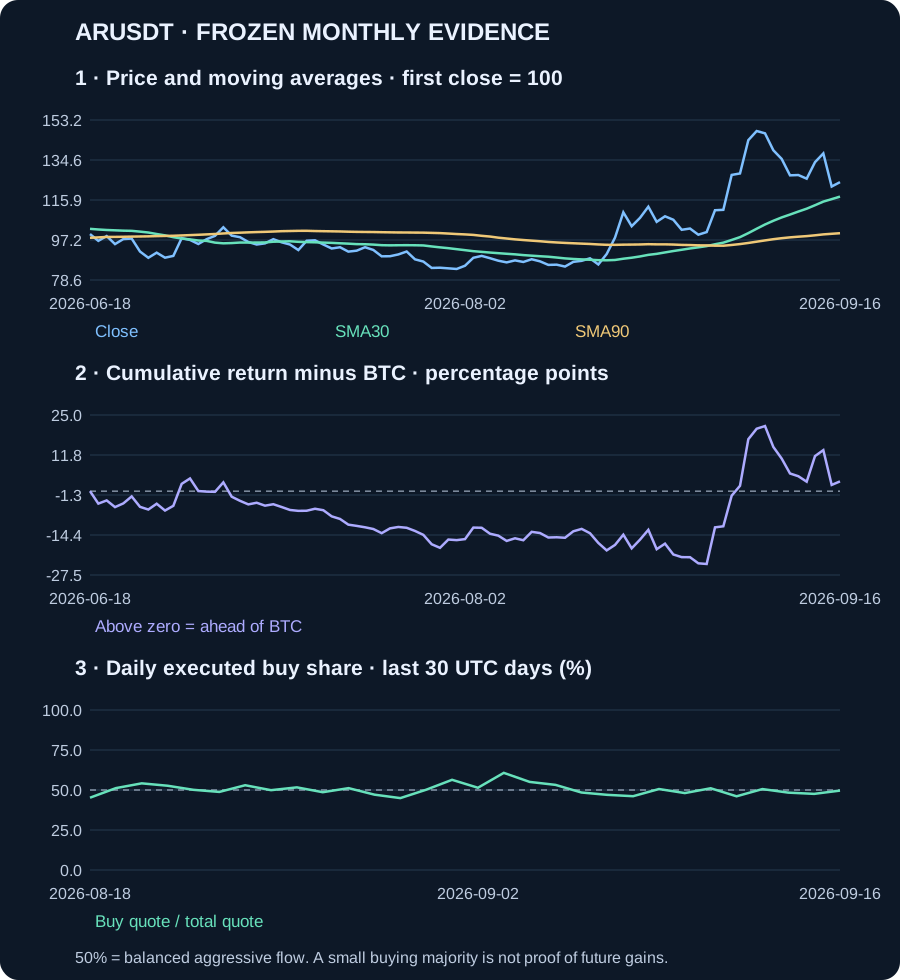
Same-edition relative rating: 9.8/10; original model score: 7.18/10. It outranks 101 of 103 scored peers. The reference close is 2.548 USDT, not a live quote. Its 30-day excess return versus BTC is +21.99 percentage points.
Why AR enters: active buying exceeds 52% of executed quote turnover, supporting its positive price trend, while the observed closing drawdown remains below 20%. The old 5m admission floor hid this combination. Its much smaller turnover and observed depth remain trade-offs, not reasons to award extra points.
Trend check: the reference close is +5.74% above SMA30 and +23.74% relative to SMA90. The 30-day buying share is +2.16 percentage points from the 50% balance line. The price trend and aggregate executed-buy balance agree; that is supporting context, not independent proof of continuation. No extension deduction applies under this model; that alone does not make the entry safe.
Why it meets the mature-market screen: 30-day median quote turnover is 2,060,803 USDT; the 7-day median is 2,088,866 USDT, with 29/30 days above 500,000 USDT. These are activity measures, not a guarantee that a large order can be filled cheaply.
Execution-risk spot check (2026-09-17T13:18:24.516060+00:00, later than the scoring cutoff): bid/ask spread 3.86 basis points; observed buy-side/sell-side notional within 0.5% of mid is 22,857/15,058 USDT. Only the first 100 levels were captured; incomplete bands are lower bounds. This one snapshot does not establish typical depth, estimate a guaranteed fill, or enter the historical score.
Executed active buying accounts for 52.16% of quote turnover. Price is +5.74% from SMA30, producing a 0.00-point extension deduction. The observed 90-day close drawdown was 18.86% and annualized daily volatility was 76.86%. Neither is a ceiling on future losses.
No complete historical selected 30-day sample is available for this coin. These selected observations are sparse and conditioned on the current survivor universe; they are not a calibrated future win rate.
Weight sensitivity: removing one factor at a time and renormalizing the remaining weights moves its rank between 1 and 10 within the currently qualifying pool. This is a sensitivity range, not a confidence interval.
What would invalidate qualification: a future review finds price at or below its updated SMA30, a non-positive 30-day return, a score below 6, drawdown above 40%, or invalid required inputs. Current SMA30 is 2.4096667 USDT; it moves with new data and is not a fixed stop-loss instruction. Before buying, separately verify project security, token supply events, custody and execution costs; this model has not cleared those risks.
| Trend | BTC-relative | Spot buying | Risk | Turnover |
|---|---|---|---|---|
| 9.71/10 | 10.00/10 | 7.16/10 | 5.55/10 | 0.00/10 |
Verify: Open full-size evidence chart · Download exact chart series · Verify original daily inputs
#3 ENA: Strong 30-day outperformance versus Bitcoin

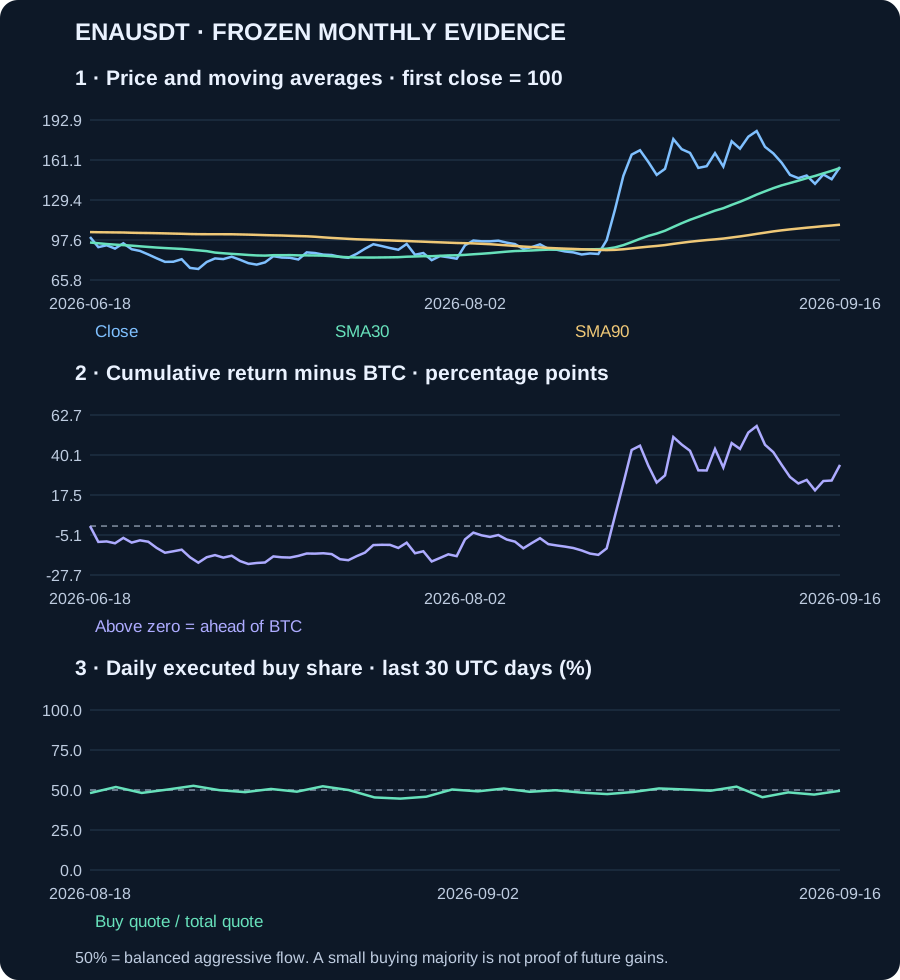
Same-edition relative rating: 9.7/10; original model score: 7.17/10. It outranks 100 of 103 scored peers. The reference close is 0.1489 USDT, not a live quote. Its 30-day excess return versus BTC is +60.88 percentage points.
Why ENA remains: strong BTC-relative momentum supports its rank, but the aggregate active-buy share is below 50%. This is a price-led candidate with conflicting flow evidence, not a fully confirmed entry.
Trend check: the reference close is +0.51% above SMA30 and +41.77% relative to SMA90. The 30-day buying share is -0.17 percentage points from the 50% balance line. There is a conflict: price momentum is positive, but aggregate aggressive selling still slightly exceeds buying. The ranking is not an immediate-entry signal. No extension deduction applies under this model; that alone does not make the entry safe.
Why it meets the mature-market screen: 30-day median quote turnover is 34,697,447 USDT; the 7-day median is 33,998,224 USDT, with 30/30 days above 500,000 USDT. These are activity measures, not a guarantee that a large order can be filled cheaply.
Execution-risk spot check (2026-09-17T13:18:24.651475+00:00, later than the scoring cutoff): bid/ask spread 6.57 basis points; observed buy-side/sell-side notional within 0.5% of mid is 197,933/197,653 USDT. Only the first 100 levels were captured; incomplete bands are lower bounds. This one snapshot does not establish typical depth, estimate a guaranteed fill, or enter the historical score.
Executed active buying accounts for 49.83% of quote turnover. Price is +0.51% from SMA30, producing a 0.00-point extension deduction. The observed 90-day close drawdown was 25.39% and annualized daily volatility was 108.77%. Neither is a ceiling on future losses.
No complete historical selected 30-day sample is available for this coin. These selected observations are sparse and conditioned on the current survivor universe; they are not a calibrated future win rate.
Weight sensitivity: removing one factor at a time and renormalizing the remaining weights moves its rank between 2 and 8 within the currently qualifying pool. This is a sensitivity range, not a confidence interval.
What would invalidate qualification: a future review finds price at or below its updated SMA30, a non-positive 30-day return, a score below 6, drawdown above 40%, or invalid required inputs. Current SMA30 is 0.14815 USDT; it moves with new data and is not a fixed stop-loss instruction. Before buying, separately verify project security, token supply events, custody and execution costs; this model has not cleared those risks.
| Trend | BTC-relative | Spot buying | Risk | Turnover |
|---|---|---|---|---|
| 10.00/10 | 10.00/10 | 4.83/10 | 3.84/10 | 4.21/10 |
Verify: Open full-size evidence chart · Download exact chart series · Verify original daily inputs
#4 UNI: Price momentum with a spot-buying edge

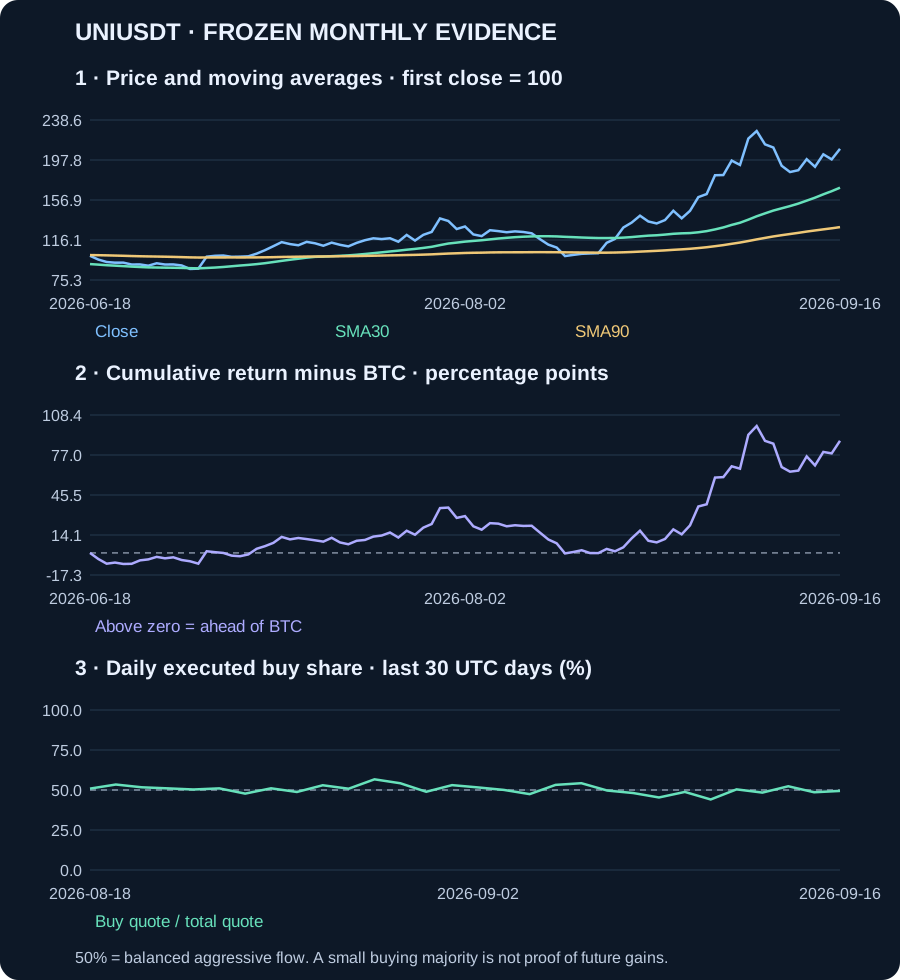
Same-edition relative rating: 9.6/10; original model score: 7.15/10. It outranks 99 of 103 scored peers. The reference close is 6.712 USDT, not a live quote. Its 30-day excess return versus BTC is +86.17 percentage points.
Why UNI remains: both momentum and the executed-buy balance point upward. The buying majority is modest and the price has already risen sharply; confirmation is weaker than the headline return might suggest.
Trend check: the reference close is +23.39% above SMA30 and +61.78% relative to SMA90. The 30-day buying share is +0.42 percentage points from the 50% balance line. The trend and aggregate executed-buy balance agree, but the buying margin is small. Price extension already incurs a deduction; waiting for a less stretched setup is different from predicting a reversal.
Why it meets the mature-market screen: 30-day median quote turnover is 50,053,344 USDT; the 7-day median is 53,162,729 USDT, with 30/30 days above 500,000 USDT. These are activity measures, not a guarantee that a large order can be filled cheaply.
Execution-risk spot check (2026-09-17T13:18:24.787365+00:00, later than the scoring cutoff): bid/ask spread 1.43 basis points; observed buy-side/sell-side notional within 0.5% of mid is 270,649/174,780 USDT. Only the first 100 levels were captured; incomplete bands are lower bounds. This one snapshot does not establish typical depth, estimate a guaranteed fill, or enter the historical score.
Executed active buying accounts for 50.42% of quote turnover. Price is +23.39% from SMA30, producing a 0.34-point extension deduction. The observed 90-day close drawdown was 27.79% and annualized daily volatility was 86.33%. Neither is a ceiling on future losses.
This coin appeared in 2 historical selected baskets; 2 have a complete 30-day outcome. Their median cost-adjusted reference return was +22.04%, with 2/2 positive. These selected observations are sparse and conditioned on the current survivor universe; they are not a calibrated future win rate.
Weight sensitivity: removing one factor at a time and renormalizing the remaining weights moves its rank between 3 and 9 within the currently qualifying pool. This is a sensitivity range, not a confidence interval.
What would invalidate qualification: a future review finds price at or below its updated SMA30, a non-positive 30-day return, a score below 6, drawdown above 40%, or invalid required inputs. Current SMA30 is 5.4398 USDT; it moves with new data and is not a fixed stop-loss instruction. Before buying, separately verify project security, token supply events, custody and execution costs; this model has not cleared those risks.
| Trend | BTC-relative | Spot buying | Risk | Turnover |
|---|---|---|---|---|
| 10.00/10 | 10.00/10 | 5.42/10 | 4.34/10 | 5.00/10 |
Verify: Open full-size evidence chart · Download exact chart series · Verify original daily inputs
#5 ZEC: High turnover and active spot buying

Same-edition relative rating: 9.5/10; original model score: 7.09/10. It outranks 98 of 103 scored peers. The reference close is 1337.89 USDT, not a live quote. Its 30-day excess return versus BTC is +142.16 percentage points.
Why ZEC remains: high quote turnover and a clearer active-buy majority support its strong relative performance. A very large recent advance is also a chasing risk; neither high activity nor the rank establishes fair value.
Trend check: the reference close is +43.03% above SMA30 and +111.43% relative to SMA90. The 30-day buying share is +1.25 percentage points from the 50% balance line. The price trend and aggregate executed-buy balance agree; that is supporting context, not independent proof of continuation. Price extension already incurs a deduction; waiting for a less stretched setup is different from predicting a reversal.
Why it meets the mature-market screen: 30-day median quote turnover is 225,583,216 USDT; the 7-day median is 333,681,393 USDT, with 30/30 days above 500,000 USDT. These are activity measures, not a guarantee that a large order can be filled cheaply.
Execution-risk spot check (2026-09-17T13:18:24.922646+00:00, later than the scoring cutoff): bid/ask spread 0.07 basis points; observed buy-side/sell-side notional within 0.5% of mid is 317,622/121,434 USDT. Only the first 100 levels were captured; incomplete bands are lower bounds. This one snapshot does not establish typical depth, estimate a guaranteed fill, or enter the historical score.
Executed active buying accounts for 51.25% of quote turnover. Price is +43.03% from SMA30, producing a 1.00-point extension deduction. The observed 90-day close drawdown was 21.05% and annualized daily volatility was 117.15%. Neither is a ceiling on future losses.
This coin appeared in 5 historical selected baskets; 5 have a complete 30-day outcome. Their median cost-adjusted reference return was -1.93%, with 2/5 positive. These selected observations are sparse and conditioned on the current survivor universe; they are not a calibrated future win rate.
Weight sensitivity: removing one factor at a time and renormalizing the remaining weights moves its rank between 1 and 16 within the currently qualifying pool. This is a sensitivity range, not a confidence interval.
What would invalidate qualification: a future review finds price at or below its updated SMA30, a non-positive 30-day return, a score below 6, drawdown above 40%, or invalid required inputs. Current SMA30 is 935.42267 USDT; it moves with new data and is not a fixed stop-loss instruction. Before buying, separately verify project security, token supply events, custody and execution costs; this model has not cleared those risks.
| Trend | BTC-relative | Spot buying | Risk | Turnover |
|---|---|---|---|---|
| 10.00/10 | 10.00/10 | 6.25/10 | 3.99/10 | 8.27/10 |
Verify: Open full-size evidence chart · Download exact chart series · Verify original daily inputs
#6 VET: A steadier price path, but thinner trading depth

Same-edition relative rating: 9.4/10; original model score: 7.01/10. It outranks 97 of 103 scored peers. The reference close is 0.00718 USDT, not a live quote. Its 30-day excess return versus BTC is +43.51 percentage points.
Why VET enters: the combination of positive momentum and a comparatively smaller observed closing drawdown fits the screen, even though its turnover earns no liquidity points. Its thin observed order book is a material caution; the relative rating must not be read as execution safety.
Trend check: the reference close is +7.85% above SMA30 and +34.40% relative to SMA90. The 30-day buying share is +0.34 percentage points from the 50% balance line. The trend and aggregate executed-buy balance agree, but the buying margin is small. No extension deduction applies under this model; that alone does not make the entry safe.
Why it meets the mature-market screen: 30-day median quote turnover is 1,577,200 USDT; the 7-day median is 1,985,324 USDT, with 29/30 days above 500,000 USDT. These are activity measures, not a guarantee that a large order can be filled cheaply.
Execution-risk spot check (2026-09-17T13:18:25.057779+00:00, later than the scoring cutoff): bid/ask spread 4.18 basis points; observed buy-side/sell-side notional within 0.5% of mid is 9,506/7,022 USDT. Only the first 100 levels were captured; incomplete bands are lower bounds. This one snapshot does not establish typical depth, estimate a guaranteed fill, or enter the historical score.
Executed active buying accounts for 50.34% of quote turnover. Price is +7.85% from SMA30, producing a 0.00-point extension deduction. The observed 90-day close drawdown was 13.71% and annualized daily volatility was 69.75%. Neither is a ceiling on future losses.
This coin appeared in 1 historical selected baskets; 1 have a complete 30-day outcome. Their median cost-adjusted reference return was -6.23%, with 0/1 positive. These selected observations are sparse and conditioned on the current survivor universe; they are not a calibrated future win rate.
Weight sensitivity: removing one factor at a time and renormalizing the remaining weights moves its rank between 2 and 9 within the currently qualifying pool. This is a sensitivity range, not a confidence interval.
What would invalidate qualification: a future review finds price at or below its updated SMA30, a non-positive 30-day return, a score below 6, drawdown above 40%, or invalid required inputs. Current SMA30 is 0.0066574333 USDT; it moves with new data and is not a fixed stop-loss instruction. Before buying, separately verify project security, token supply events, custody and execution costs; this model has not cleared those risks.
| Trend | BTC-relative | Spot buying | Risk | Turnover |
|---|---|---|---|---|
| 10.00/10 | 10.00/10 | 5.34/10 | 6.30/10 | 0.00/10 |
Verify: Open full-size evidence chart · Download exact chart series · Verify original daily inputs
#7 DASH: Rising trend with buyers slightly ahead

Same-edition relative rating: 9.3/10; original model score: 6.94/10. It outranks 96 of 103 scored peers. The reference close is 56.13 USDT, not a live quote. Its 30-day excess return versus BTC is +66.00 percentage points.
Why DASH remains: price trend and a small aggregate buying majority agree. That is supportive context, but the limited buy-side margin and substantial historical drawdown leave room for reversals.
Trend check: the reference close is +17.15% above SMA30 and +47.90% relative to SMA90. The 30-day buying share is +0.59 percentage points from the 50% balance line. The trend and aggregate executed-buy balance agree, but the buying margin is small. Price extension already incurs a deduction; waiting for a less stretched setup is different from predicting a reversal.
Why it meets the mature-market screen: 30-day median quote turnover is 14,563,715 USDT; the 7-day median is 8,960,088 USDT, with 30/30 days above 500,000 USDT. These are activity measures, not a guarantee that a large order can be filled cheaply.
Execution-risk spot check (2026-09-17T13:18:25.192704+00:00, later than the scoring cutoff): bid/ask spread 1.74 basis points; observed buy-side/sell-side notional within 0.5% of mid is 138,706/102,988 USDT. Only the first 100 levels were captured; incomplete bands are lower bounds. This one snapshot does not establish typical depth, estimate a guaranteed fill, or enter the historical score.
Executed active buying accounts for 50.59% of quote turnover. Price is +17.15% from SMA30, producing a 0.09-point extension deduction. The observed 90-day close drawdown was 29.28% and annualized daily volatility was 100.75%. Neither is a ceiling on future losses.
This coin appeared in 2 historical selected baskets; 2 have a complete 30-day outcome. Their median cost-adjusted reference return was -2.23%, with 1/2 positive. These selected observations are sparse and conditioned on the current survivor universe; they are not a calibrated future win rate.
Weight sensitivity: removing one factor at a time and renormalizing the remaining weights moves its rank between 4 and 10 within the currently qualifying pool. This is a sensitivity range, not a confidence interval.
What would invalidate qualification: a future review finds price at or below its updated SMA30, a non-positive 30-day return, a score below 6, drawdown above 40%, or invalid required inputs. Current SMA30 is 47.913333 USDT; it moves with new data and is not a fixed stop-loss instruction. Before buying, separately verify project security, token supply events, custody and execution costs; this model has not cleared those risks.
| Trend | BTC-relative | Spot buying | Risk | Turnover |
|---|---|---|---|---|
| 10.00/10 | 10.00/10 | 5.59/10 | 3.71/10 | 2.32/10 |
Verify: Open full-size evidence chart · Download exact chart series · Verify original daily inputs
#8 CAKE: Strong momentum with a 6.9% historical drawdown

Same-edition relative rating: 9.2/10; original model score: 6.91/10. It outranks 95 of 103 scored peers. The reference close is 2.31 USDT, not a live quote. Its 30-day excess return versus BTC is +39.48 percentage points.
Why CAKE remains: its positive trend and relatively shallow historical closing drawdown support the score. However, active selling slightly exceeds buying; price strength is not yet matched by a majority buy-flow reading.
Trend check: the reference close is +18.33% above SMA30 and +45.88% relative to SMA90. The 30-day buying share is -0.44 percentage points from the 50% balance line. There is a conflict: price momentum is positive, but aggregate aggressive selling still slightly exceeds buying. The ranking is not an immediate-entry signal. Price extension already incurs a deduction; waiting for a less stretched setup is different from predicting a reversal.
Why it meets the mature-market screen: 30-day median quote turnover is 5,266,765 USDT; the 7-day median is 5,489,054 USDT, with 30/30 days above 500,000 USDT. These are activity measures, not a guarantee that a large order can be filled cheaply.
Execution-risk spot check (2026-09-17T13:18:25.327895+00:00, later than the scoring cutoff): bid/ask spread 4.17 basis points; observed buy-side/sell-side notional within 0.5% of mid is 39,405/35,445 USDT. Only the first 100 levels were captured; incomplete bands are lower bounds. This one snapshot does not establish typical depth, estimate a guaranteed fill, or enter the historical score.
Executed active buying accounts for 49.56% of quote turnover. Price is +18.33% from SMA30, producing a 0.13-point extension deduction. The observed 90-day close drawdown was 6.93% and annualized daily volatility was 56.00%. Neither is a ceiling on future losses.
No complete historical selected 30-day sample is available for this coin. These selected observations are sparse and conditioned on the current survivor universe; they are not a calibrated future win rate.
Weight sensitivity: removing one factor at a time and renormalizing the remaining weights moves its rank between 3 and 11 within the currently qualifying pool. This is a sensitivity range, not a confidence interval.
What would invalidate qualification: a future review finds price at or below its updated SMA30, a non-positive 30-day return, a score below 6, drawdown above 40%, or invalid required inputs. Current SMA30 is 1.9521 USDT; it moves with new data and is not a fixed stop-loss instruction. Before buying, separately verify project security, token supply events, custody and execution costs; this model has not cleared those risks.
| Trend | BTC-relative | Spot buying | Risk | Turnover |
|---|---|---|---|---|
| 10.00/10 | 10.00/10 | 4.56/10 | 7.44/10 | 0.11/10 |
Verify: Open full-size evidence chart · Download exact chart series · Verify original daily inputs
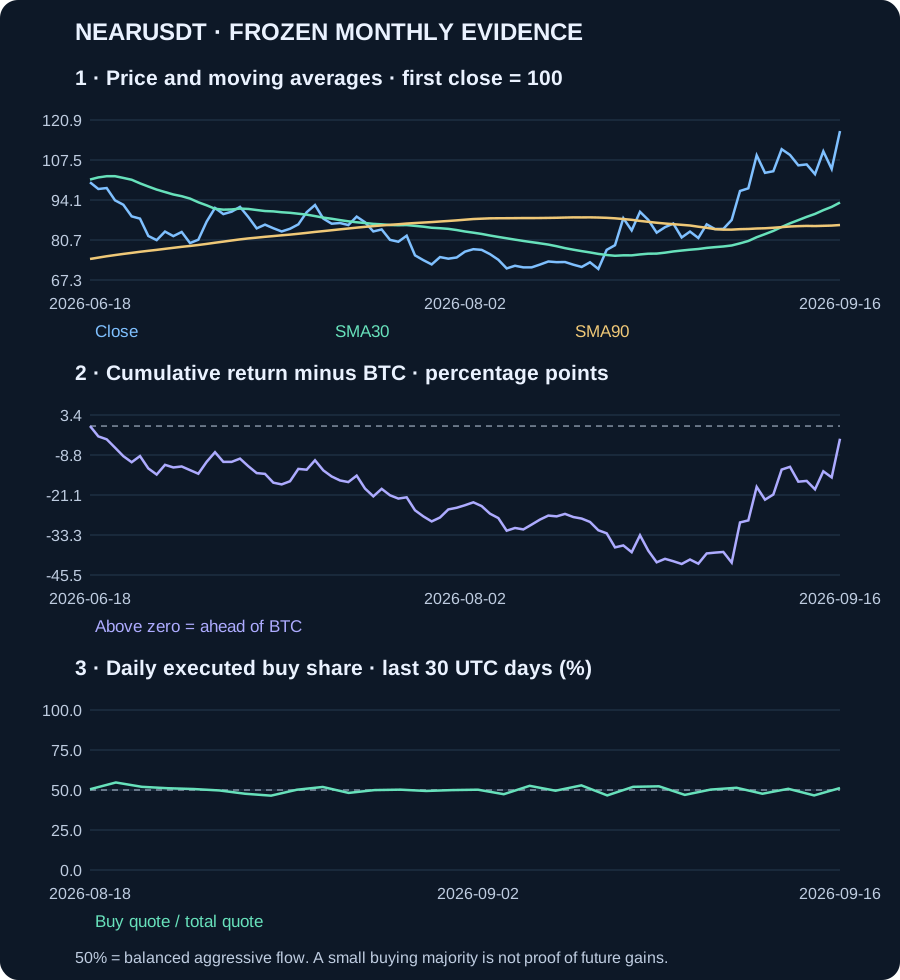
#9 NEAR: A 60% monthly gain, ahead of Bitcoin

Same-edition relative rating: 9.0/10; original model score: 6.82/10. It outranks 93 of 103 scored peers. The reference close is 2.621 USDT, not a live quote. Its 30-day excess return versus BTC is +41.92 percentage points.
Why NEAR remains: strong performance against BTC and substantial quote turnover support its inclusion. The active-buy majority is very small, so the evidence is mainly trend strength rather than decisive accumulation.
Trend check: the reference close is +25.66% above SMA30 and +36.71% relative to SMA90. The 30-day buying share is +0.24 percentage points from the 50% balance line. The trend and aggregate executed-buy balance agree, but the buying margin is small. Price extension already incurs a deduction; waiting for a less stretched setup is different from predicting a reversal.
Why it meets the mature-market screen: 30-day median quote turnover is 44,279,523 USDT; the 7-day median is 46,955,798 USDT, with 30/30 days above 500,000 USDT. These are activity measures, not a guarantee that a large order can be filled cheaply.
Execution-risk spot check (2026-09-17T13:18:25.463121+00:00, later than the scoring cutoff): bid/ask spread 3.48 basis points; observed buy-side/sell-side notional within 0.5% of mid is 305,219/223,098 USDT. Only the first 100 levels were captured; incomplete bands are lower bounds. This one snapshot does not establish typical depth, estimate a guaranteed fill, or enter the historical score.
Executed active buying accounts for 50.24% of quote turnover. Price is +25.66% from SMA30, producing a 0.43-point extension deduction. The observed 90-day close drawdown was 29.01% and annualized daily volatility was 77.43%. Neither is a ceiling on future losses.
This coin appeared in 2 historical selected baskets; 2 have a complete 30-day outcome. Their median cost-adjusted reference return was -19.36%, with 0/2 positive. These selected observations are sparse and conditioned on the current survivor universe; they are not a calibrated future win rate.
Weight sensitivity: removing one factor at a time and renormalizing the remaining weights moves its rank between 6 and 15 within the currently qualifying pool. This is a sensitivity range, not a confidence interval.
What would invalidate qualification: a future review finds price at or below its updated SMA30, a non-positive 30-day return, a score below 6, drawdown above 40%, or invalid required inputs. Current SMA30 is 2.0857333 USDT; it moves with new data and is not a fixed stop-loss instruction. Before buying, separately verify project security, token supply events, custody and execution costs; this model has not cleared those risks.
| Trend | BTC-relative | Spot buying | Risk | Turnover |
|---|---|---|---|---|
| 9.36/10 | 10.00/10 | 5.24/10 | 4.52/10 | 4.74/10 |
Verify: Open full-size evidence chart · Download exact chart series · Verify original daily inputs
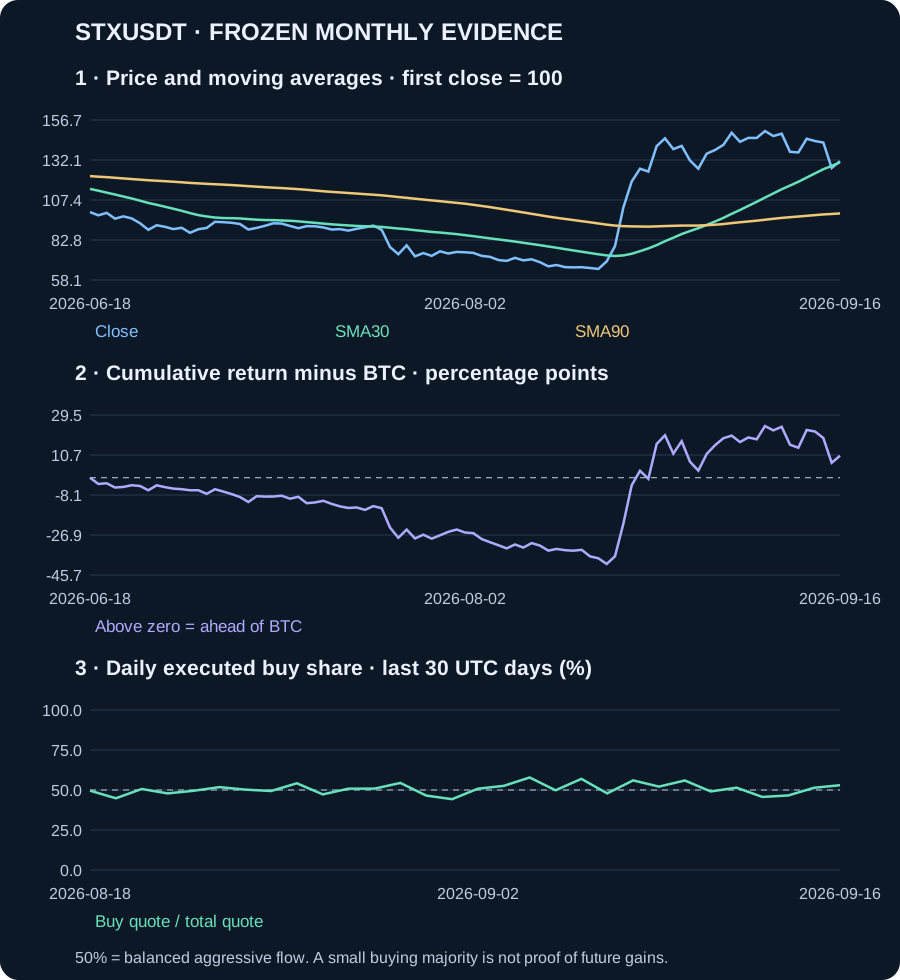
#10 STX: Strong momentum with elevated drawdown risk

Same-edition relative rating: 8.8/10; original model score: 6.60/10. It outranks 91 of 103 scored peers. The reference close is 0.2428 USDT, not a live quote. Its 30-day excess return versus BTC is +82.41 percentage points.
Why STX enters: pronounced price momentum compensates for weak risk and turnover components. Its 90-day closing drawdown is already near the exclusion limit, and the spot-check spread is wider than other finalists. This is a higher-risk research candidate, not a safe substitute for the coins displaced.
Trend check: the reference close is +0.56% above SMA30 and +32.48% relative to SMA90. The 30-day buying share is +0.56 percentage points from the 50% balance line. The trend and aggregate executed-buy balance agree, but the buying margin is small. No extension deduction applies under this model; that alone does not make the entry safe.
Why it meets the mature-market screen: 30-day median quote turnover is 2,225,262 USDT; the 7-day median is 1,735,506 USDT, with 29/30 days above 500,000 USDT. These are activity measures, not a guarantee that a large order can be filled cheaply.
Execution-risk spot check (2026-09-17T13:18:25.598178+00:00, later than the scoring cutoff): bid/ask spread 12.15 basis points; observed buy-side/sell-side notional within 0.5% of mid is 19,666/15,309 USDT. Only the first 100 levels were captured; incomplete bands are lower bounds. This one snapshot does not establish typical depth, estimate a guaranteed fill, or enter the historical score.
Executed active buying accounts for 50.56% of quote turnover. Price is +0.56% from SMA30, producing a 0.00-point extension deduction. The observed 90-day close drawdown was 35.06% and annualized daily volatility was 97.09%. Neither is a ceiling on future losses.
This coin appeared in 1 historical selected baskets; 1 have a complete 30-day outcome. Their median cost-adjusted reference return was +25.30%, with 1/1 positive. These selected observations are sparse and conditioned on the current survivor universe; they are not a calibrated future win rate.
Weight sensitivity: removing one factor at a time and renormalizing the remaining weights moves its rank between 4 and 14 within the currently qualifying pool. This is a sensitivity range, not a confidence interval.
What would invalidate qualification: a future review finds price at or below its updated SMA30, a non-positive 30-day return, a score below 6, drawdown above 40%, or invalid required inputs. Current SMA30 is 0.24144667 USDT; it moves with new data and is not a fixed stop-loss instruction. Before buying, separately verify project security, token supply events, custody and execution costs; this model has not cleared those risks.
| Trend | BTC-relative | Spot buying | Risk | Turnover |
|---|---|---|---|---|
| 10.00/10 | 10.00/10 | 5.56/10 | 3.26/10 | 0.00/10 |
Verify: Open full-size evidence chart · Download exact chart series · Verify original daily inputs
How the monthly replay avoids look-ahead—and where it remains biased
At each month’s first UTC midnight from March 2024, calculate inputs using only preceding closed days. Reference entry is that next day’s open; exits are the 7th, 30th and 90th daily closes. Future bars are never scoring inputs. A missing future bar makes that outcome null; incomplete selected baskets are not averaged over just the surviving winners.
Each selected basket is equal-weighted. Net reference return = mean(exit close / entry open − 1) − 0.002. The 20 basis-point round-trip assumption is the same for BTC and the eligible-pool benchmark. It is not a fill simulation: spreads, market impact, taxes and venue-specific fees can be larger. No leverage or perpetual funding is modeled.
The date logic prevents price look-ahead, but it does not remove universe look-ahead: today’s eligible pool is replayed backward. Delisted assets and assets that fail today’s liquidity criteria are absent. Historical inputs were recovered later; this is not a point-in-time archive of what CoinNudge recommended then.
MDD90 uses the running peak of the 91 daily closes, while individual forward MAE/MFE in the downloads use daily lows/highs relative to next-open entry. Annualized volatility uses the sample standard deviation of 90 log close returns multiplied by sqrt(365). These are different risk measurements.
Intervals resample the chronologically ordered completed-basket series using circular blocks of three observations, 2,000 draws, Python random.Random seed 17092026, and linearly interpolated 2.5/97.5 percentiles. Missing/no-selection months are omitted, so blocks need not be three consecutive calendar months. Intervals are descriptive, conditional on this pool, and are suppressed below 12 observations; they do not correct survivor bias or establish significance.
The public release contains every month, every pool member’s score or exclusion, all available forward results, and input daily bars. The first genuinely prospective record is this September release. Seven-, 30- and 90-day performance after publication cannot be reported until those horizons have elapsed.
This release reruns every historical month with the revised sustained-turnover conditions evaluated using only data preceding that monthly decision. Relative stars are a presentational transformation of the current raw ranks; they are not an additional historical selection condition. The peer pool is still drawn from today’s retained markets, so universe selection bias remains.
Verify: Full research JSON · Historical observations CSV · Input daily bars CSV
Every historical month, including weak and incomplete results
Returns are for separate monthly experiments, not a compounded account equity curve. A dash is missing/incomplete data or no selected basket, never a zero return. Pool is the equal-weighted scoreable current-universe subset on that historical date; membership changes as history becomes available.
| Decision month | Selected count | 30d selected net | 30d BTC net | 30d pool net | 90d selected net |
|---|---|---|---|---|---|
| 2024-03 | 10 | +14.87% | +13.62% | +32.86% | -0.02% |
| 2024-04 | 10 | -29.21% | -15.08% | -31.99% | -32.06% |
| 2024-05 | 0 | — | +12.46% | +16.38% | — |
| 2024-06 | 5 | -7.72% | -7.26% | -22.50% | -20.69% |
| 2024-07 | 1 | +6.46% | +5.24% | -2.21% | +24.18% |
| 2024-08 | 6 | -7.94% | -8.72% | -13.78% | +17.54% |
| 2024-09 | 2 | +9.72% | +7.18% | +20.69% | +41.36% |
| 2024-10 | 6 | +4.12% | +14.04% | -0.51% | +89.23% |
| 2024-11 | 9 | +50.23% | +36.95% | +86.50% | +29.62% |
| 2024-12 | 10 | -10.60% | -3.95% | -13.77% | -38.73% |
| 2025-01 | 0 | — | +11.71% | -7.33% | — |
| 2025-02 | 10 | -22.18% | -8.17% | -22.52% | -35.64% |
| 2025-03 | 1 | -32.95% | -2.52% | -18.28% | -27.40% |
| 2025-04 | 0 | — | +13.88% | +13.02% | — |
| 2025-05 | 0 | — | +10.22% | +1.89% | — |
| 2025-06 | 6 | +1.16% | +2.24% | -7.06% | +12.12% |
| 2025-07 | 9 | +12.97% | +9.78% | +24.10% | -4.01% |
| 2025-08 | 10 | +4.75% | -6.20% | +2.32% | -10.34% |
| 2025-09 | 10 | -7.58% | +5.16% | -2.29% | -21.97% |
| 2025-10 | 5 | +43.68% | -5.22% | -17.61% | +83.30% |
| 2025-11 | 5 | -15.31% | -17.76% | -19.60% | -38.24% |
| 2025-12 | 2 | +3.43% | -2.27% | -13.47% | -2.15% |
| 2026-01 | 1 | -7.94% | -4.07% | -5.48% | -22.40% |
| 2026-02 | 1 | +7.04% | -12.79% | -11.20% | -21.39% |
| 2026-03 | 1 | +24.58% | -0.46% | -4.82% | +100.89% |
| 2026-04 | 3 | +17.21% | +11.61% | +6.58% | +3.92% |
| 2026-05 | 8 | +10.70% | -3.43% | +5.25% | +5.53% |
| 2026-06 | 10 | -16.15% | -20.63% | -19.75% | -2.22% |
| 2026-07 | 1 | -30.06% | +10.30% | +1.38% | — |
| 2026-08 | 4 | -13.58% | +23.32% | +14.85% | — |
| 2026-09 | 10 | — | — | — | — |
Should you buy the highest-scoring coin immediately?
No. The score organizes market evidence; it does not know your finances, holding period, ability to absorb losses or existing concentration. A high score can coexist with stretched price, weak active buying, an upcoming unlock or project-specific risk not measured here.
The ranking does not include token valuation, protocol revenue, security audits, governance concentration, unlock schedules, cross-exchange liquidity, OI or funding. These are not silently assumed safe. Comparable long histories for those features were not used in this release; adding them later requires a new method version and fresh validation.
A relative 9.9/10 means near the top of this edition’s peer pool, not a 99% probability of profit. A raw 7.3/10 measures fixed model fit, not 73% odds. Small decimal gaps are not meaningful certainty. Spreading exposure across correlated coins does not automatically diversify risk.
Monthly updates, frozen evidence and reproducible downloads
This is the September 2026 edition, using closed data through 2026-09-17 00:00 UTC (exclusive). The original publication time is 2026-09-17T13:29:10.249689Z. The current page keeps one stable URL; the frozen dataset release below is never overwritten.
Next editorial review is scheduled for October 1, 2026. This is a manual review commitment, not an already-running automatic publication service. If a review is late, the existing edition and cutoff stay visible; the site must not relabel old scores as fresh. New releases will retain prior scores and disclose changes in rules and membership.
The study uses Binance public REST closed daily klines for OHLCV and taker-buy quote volume, plus frozen official exchange and product-classification directories. Recovered historical candles are not a historically available CoinNudge recommendation.
The original data remains subject to upstream terms; this page does not grant a blanket redistribution license. Recompute with inputs.csv and scoring.py; research.json contains all scores, exclusions, monthly outcomes and the exact current universe. manifest.json lists SHA-256 checksums. No user data is included.
Verify: Scores CSV · Monthly replay CSV · Full JSON · Input CSV · SHA-256 manifest · Scoring source
Follow changing conditions without mistaking this list for an alert strategy
For individual users, CoinNudge Telegram alerts can help monitor supported price, volume, technical and positioning events after you choose coins to follow. This monthly scoring model is not itself a promised automatic buy/sell alert category. Check supported symbols and categories before paying.
For research teams, the public frozen inputs and outcome ledger let you challenge the ranking. The commercial Market Events dataset has its own scope and access terms; this ranking is not proof that every historical data family is included in a subscription.
Verify: See Telegram alert coverage · View personal plans · Explore data products · Check the data sample · Compare data plans
Take the next step with this evidence.
Reading about top 10 cryptocurrencies to consider buying now? Choose ongoing notifications or a dataset you can inspect in your own research workflow.
Receive qualifying events in Telegram.
Use the ready-made alert checklist, message explanations and daily briefing. Check the supported categories and coins before subscribing; every Research page is not a separate alert category.
Check the alert list · View alert plans
Inspect the data before choosing a plan.
Market Events v1 connects recorded events and comparison rows with context, later outcomes and quality flags. Paid access provides customer API keys and daily JSON, CSV and Parquet files.
Check Market Events sample · Explore the full data catalog · Compare data plans
Researcher and Research Desk currently include Market Events v1 only, for its specified pairs and published history. This page's full dataset is not automatically included. Other data families require coverage, date, field and source-use confirmation before purchase. Telegram Pro and data access are separate subscriptions.
Frequently asked questions
Which crypto should I buy now?
Our September 2026 screen publishes the top 10 research candidates, led by BNB, AR, ENA, from 103 eligible Binance USDT spot markets. The process starts with the official spot directory and applies the published eligibility and risk rules. That is not a personalized instruction to buy. Scores, entry cautions, historical failures and the exact cutoff are published above.
How many coins are screened, and can fewer than ten qualify?
Every active spot base asset in the frozen official directory is audited. This edition has 103 markets meeting the daily-history and turnover rules; 20 pass the score and risk gates, with at most ten displayed. Non-USDT-only assets and excluded asset classes are counted explicitly. No thresholds are relaxed to fill places.
Does a 9.9/10 relative rating mean a 99% chance of profit?
No. It is 10 times the fraction of the 103 current scoreable peers with lower raw model scores. It is neither expected return nor safety. Raw model scores, absolute risk gates and historical failures are shown separately; high relative standing can coexist with losses.
Are these the best cryptocurrencies for long-term investment?
The study measures market conditions, not fundamental fair value or long-term project viability. It does not establish which token is the best multi-year investment.
Why not simply buy Bitcoin or Ethereum?
BTC and ETH are evaluated using the same rules. The historical tables compare the selected basket with BTC and the eligible-pool benchmark; mixed results do not establish that selecting altcoins is superior.
Is 90 days enough data to validate the method?
Ninety days defines current price context, requiring 91 daily closes. Historical monthly replays begin in March 2024 where inputs exist. Those replays still have survivor bias and are not independent prospective validation.
Can I use the list for day trading or leverage?
This is a monthly spot research screen, not an intraday timing or leveraged-execution model. It does not estimate liquidation prices, funding costs or intraday fills.
How often does the list change?
The static article is reviewed monthly, with the next editorial review scheduled for October 1, 2026. Old editions keep their original cutoff, and frozen downloads are preserved. It is not a live ranking.
Can I download and reproduce the ratings?
Yes. The release provides full research JSON, score and historical CSVs, daily input CSV, scoring implementation and SHA-256 manifest. No account is needed to inspect this public release.
Will Telegram send alerts when a coin changes rank?
Not as a promised feature of this release. Telegram Pro covers its published alert checklist. The monthly research ranking is reviewed separately and is not an automated buy/sell service.
Why can a coin have a 9.9 relative rating but a 7.3 raw model score?
They answer different questions. Relative rating describes its standing against this edition’s peers; raw model score describes compliance with fixed technical, flow, risk and turnover formulas. The relative transformation never changes the original score or relaxes admission gates.
Sources and verification
- Binance Spot Kline fieldsOfficial closed OHLCV and taker-buy quote field definitions.
- Binance public historical dataOfficial archived candles, formats and timestamp conventions.
- Frozen monthly research releaseActual calculations, selected and excluded coins, and all monthly replay results.
- Reproduction inputsPublic daily input bars used in this release.
- Research standardsScope, corrections and uncertainty disclosures.
Monitor supported market events in Telegram.
Choose notifications or inspect research data; neither guarantees returns.
Explore alert coverage