Single-asset evidence report · By CoinNudge Research · · Guide updated 2026-10-03 · 20 min read
What is SOL coin, and is it worth holding?
SOL is the native asset of the Solana blockchain, used for network fees and staking; it is not a direct claim on the revenue of every application built there. For a holding decision, a defensible SOL holding case weighs sustained user-paid network fee demand and staking economics against issuance, validator concentration and the historically large drawdowns visible in the matched paths. In the frozen Binance spot daily-open window ending September 25, 2026, SOL returned +62.8% versus BTC +40.5%; across 57 earlier monthly starts, its median was −2.7% and 24/57 beat BTC. Overlapping history is not a future win rate or personal buy call.
Inspect all historical starts · Check current market context
What should investors know about SOL?
- SOL gained +62.8% in the last frozen 90-day window; this differs from its historical monthly-start median −2.7%.
- 24/57 complete historical 90-day starts beat BTC, while 56/57 had a deeper daily-open drawdown.
- A defensible SOL holding case weighs sustained user-paid network fee demand and staking economics against issuance, validator concentration and the historically large drawdowns visible in the matched paths.
What is SOL coin, and which Solana fees require it?
SOL is the native asset of the Solana blockchain, used for network fees and staking; it is not a direct claim on the revenue of every application built there.
SOL is a network asset, not ownership in every Solana application. Separate the SOL paid for chain execution from trading or service charges retained by an app.
A holding review then asks who receives network fees, how staking rewards compare with issuance and commission, and what risk appears in same-date BTC comparisons. The 57 frozen monthly-start observations below are unlevered, unstaked spot paths—not a staking performance backtest.
| SOL at a glance | Dated evidence | How to read it |
|---|---|---|
| Documented token role | Pays network transaction fees; can hold the native asset | Not an automatic claim on every project activity |
| Last frozen 90-day spot return | +62.8% | BTC on the same UTC dates: +40.5% |
| Historical 90-day monthly median | −2.7% | 57 overlapping complete starts, not a forecast |
| Current circulating supply | 587,712,925 | CoinGecko response updated 2026-09-26T08:35:30.000Z |
Verify: Solana transaction fee documentation · Solana staking and inflation guide · Solana fee structure
Does holding SOL receive all app revenue or only enable staking?
An ordinary SOL holder can pay network fees and may delegate stake under network rules, but does not automatically receive every app's profits or the validator's fee income. Holding, delegating and operating a validator are different activities.
The fee documentation distinguishes a burned component, validator receipts and optional prioritization fees. Trace each reported revenue figure to its recipient before treating it as holder income; app fees belong to their own contracts or operators unless a separate mechanism is evidenced.
A delegated staker's outcome depends on earned rewards, validator commission and operation as well as SOL's market price. A claimed APY should state whether commission is already deducted. The historical spot comparison below does not add hypothetical staking rewards.
| Who owns what | Documented role or participation | What cannot be inferred |
|---|---|---|
| SOL holder | Pays network transaction fees; can hold the native asset | No automatic claim on all application profits |
| SOL staker | Delegates to a validator and may earn network rewards | Rewards vary and do not guarantee positive real returns |
| Validator | Receives documented portions of fees and protocol rewards | Validator revenue is not paid equally to passive holders |
Verify: Solana transaction fee documentation · Solana staking and inflation guide · Solana fee structure
Does staking SOL improve your holding result after commission and exit delays?
Not automatically. SOL staking adds variable token rewards, but those rewards can be outweighed by the token's price decline or costs. Gross reward yield, supply inflation and fiat-valued investment return answer different questions.
For your own scenario, calculate ending value as ending SOL units times the exit price, less entry/exit and transfer costs, then compare with the same starting cash budget left in liquid SOL or BTC. Use rewards actually credited after any commission; do not deduct the same fee twice or assume a headline annual rate held over the full period. This is a calculation framework, not a new empirical staking result.
Solana's staking guide describes activation/deactivation states before funds can be withdrawn. Check the actual stake account and current terms when planning an exit; a displayed balance does not certify immediate availability. The frozen 57-window study excludes staking and therefore cannot answer which validator or yield product would have improved those paths.
Verify: Solana staking rewards, commission and withdrawal timing · Frozen unstaked SOL/BTC spot study
Who captures Solana fees: SOL holders, validators or app operators?
SOL is required for Solana transaction fees and can be staked, but application revenue is not automatically a distribution to every SOL owner.
Solana’s fee documentation states that transactions pay in SOL. The base fee has a burned portion and a validator portion; priority fees go to the validator under the documented current structure. That is more precise than saying all chain fees are burned or all user spending rewards holders. App-level trading revenue may belong to app operators or other token holders.
SOL can be staked for protocol rewards, but staking yield must be read beside issuance, validator commission and token-price risk. Solana’s own staking guide makes clear that rewards vary with inflation, total stake and validator operation. A protocol with heavy activity can still have different economics for validators, stakers and unstaked SOL holders.
To assess network value capture, separate total user spending into app charges, base fees and priority fees, then identify burns and recipients. More transaction activity can raise service use without distributing every paid dollar to passive SOL holders. This release verifies the mechanism and price path but does not supply a longitudinal net-revenue attribution model.
SOL's dated price experiment below measures spot returns and drawdown paths, not the causal contribution of project adoption. The release has no independently frozen continuous operating-economics series that completes this value-capture test.
Verify: Solana transaction fee documentation · Solana staking and inflation guide · Solana fee structure
How do SOL issuance, fee burns and staking affect supply?
SOL supply reflects protocol issuance and fee burning; staking rewards and the market return of those rewarded tokens are different measures. A missing maximum-supply field is not a zero cap or proof that future issuance has stopped.
CoinGecko’s separate 2026-09-26T08:35:30.000Z response reports 587,712,925 circulating SOL out of 634,764,148 total, with no maximum-supply field. These are provider classifications, not an audit of custodian balances or a schedule of future exchange selling.
CoinGecko’s frozen response has circulating and total SOL but no maximum supply. That is consistent with examining ongoing issuance rather than inventing a 21-million-style cap. Compare dated token creation, base-fee burn and staking rewards; never equate nominal staking APR with a guaranteed real investment return.
SOL's supply analysis needs actual issuance and fee burning over the same dates, not a generic allocation-cliff calendar. Check protocol parameters, staking participation and validator charges; separately inspect any restricted inventory relevant to your horizon. The provider's missing maximum field is not a zero cap or zero issuance. A nominal token reward can coexist with a shrinking fiat-valued position.
| SOL supply field | Frozen provider value | Reading rule |
|---|---|---|
| Circulating supply | 587,712,925 | CoinGecko provider definition at 2026-09-26T08:35:30.000Z |
| Total supply | 634,764,148 | May differ from circulating and maximum supply |
| Maximum supply | Not reported | Missing is not zero and not equal to total supply |
| Reported circulating / maximum | Not defined | Not a dated release schedule or tradable-float audit |
Verify: Frozen original supply response · Solana transaction fee documentation · Solana staking and inflation guide · Solana fee structure
How do SOL tokenomics, staking issuance and transaction fees affect holders?
SOL funds staking rewards through an inflationary issuance schedule rather than a fixed maximum supply. Gross delegated-staking yield differs from net real return after issuance dilution, validator commission and price changes. SOL ownership is not Solana Labs equity or an automatic claim on application revenue.
Compare enacted issuance, staked participation, commissions, fees and outstanding supply over a common interval, and check your actual withdrawal and validator conditions. The documented schedule parameters are not a quoted current APY. A September price-path sample does not establish today’s staking economics.
| Token-economics dimension | Documented mechanism or attributed claim | What remains unproven / investor implication |
|---|---|---|
| Supply model | SOL has an inflationary staking-issuance schedule rather than a fixed maximum supply. Solana documents its originally proposed 8% starting rate, 15% annual disinflation and 1.5% long-term rate. | Those are schedule parameters, not today’s effective staking yield; verify the current network setting. |
| Distribution | New issuance rewards validators and delegated stake; transaction fees and validator commission alter realised economics. | Staking rewards redistribute newly issued tokens and are not risk-free investment profit. |
| Use and rights | SOL pays transaction and priority fees and can be delegated for network security. | Holding SOL does not grant equity in Solana Labs or automatic revenue from applications. |
| Investor check | Compare active issuance, staked share, validator commission, fees and actual supply change at a common date. | Do not confuse gross reward APY with net real return after dilution. |
Verify: Solana official staking and inflation FAQ · Solana transaction-fee documentation
Did SOL’s recent rally reverse its longer-term loss versus BTC?
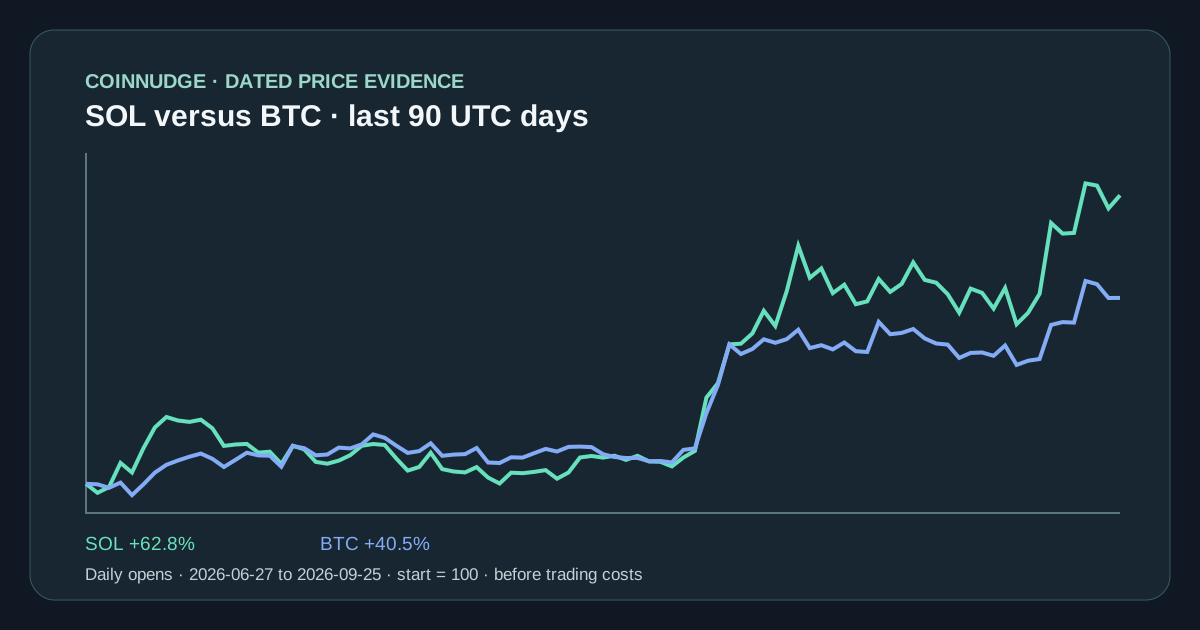
At the September 25 UTC daily-open endpoint, SOL returned +62.8% over 90 days versus BTC +40.5% on exactly the same days. The 365-day SOL path was −44.7% versus BTC −25.5%. These different windows are one dated path each—not five independent tests or a prediction.
The 90-day chart plots all 91 matched UTC daily opens from 2026-06-27 to 2026-09-25, normalized to 100 on the first day. A later CoinGecko price or 24-hour change may differ because the venue, market window and timestamp differ. The table reports the actual shared-start comparison rather than mixing unrelated provider percentages.
| Matched holding window | SOL spot return | BTC spot return | SOL minus BTC / status |
|---|---|---|---|
| 7 days | +15.2% | +10.5% | 4.7 pp |
| 30 days | +21.2% | +7.5% | 13.7 pp |
| 90 days | +62.8% | +40.5% | 22.3 pp |
| 180 days | +42.6% | +27.2% | 15.4 pp |
| 365 days | −44.7% | −25.5% | -19.2 pp |
Verify: Full dated path and methods
Across 57 SOL windows, how did returns and drawdowns compare with BTC?
Across the frozen matched 90-day monthly starts, SOL's median return was −2.7% versus BTC +1.9%, and 24/57 starts beat BTC. That is descriptive historical evidence, not a future success probability; the full overlapping sample, dependence check and opposing cases appear below.
We prespecified every first day of a month after the Binance listing had a full prior month, through June 2026. Of 57 candidate 90-day starts, 57 had a complete 91-daily-open SOL/BTC pair and 0 were excluded for missing daily opens. The SOL median endpoint was −2.7%, BTC's was +1.9%; SOL beat BTC in 24/57. Those windows overlap and must not be treated as 57 independent win-probability trials.
SOL had a deeper daily-open peak-to-trough drawdown in 56/57 matched windows. The lower 10th-percentile SOL endpoint was −51.2% and the upper 90th percentile +84.2%. Every-third-month sensitivity has only 19 observations and 9 BTC-beating starts; it is a dependence check, not a statistically powered forecast.
The worst BTC-relative start was 2022-10-01: −71.0% for SOL against −14.4% BTC, with −73.9% asset drawdown. A counterexample is 2023-10-01: +396.8% for SOL versus +56.0% BTC. Showing both prevents the current rally or a past collapse from becoming the whole story.
| 90-day monthly cohort measure | SOL | BTC / paired comparison | Interpretation |
|---|---|---|---|
| Complete starts | 57 | 57 | Same UTC dates and 91 daily opens |
| Median endpoint | −2.7% | +1.9% | Not an expected future return |
| 10th / 90th percentile | −51.2% / +84.2% | −24.9% / +47.8% | Descriptive tail range |
| Outperformed BTC | 24/57 | — | Overlapping monthly windows |
| Deeper path drawdown | 56/57 | — | Measured at daily opens only |
| Every-third-month check | 9/19 | — | Small non-overlap sensitivity |
Verify: All matched starts and excluded candidates · Frozen calculation contract
Which SOL entry dates won or lost—and how painful was the path?
Both winning and losing SOL windows are shown: all 57 eligible same-date SOL/BTC 90-day observations are visible chronologically below. The worst BTC-relative start was 2022-10-01: −71.0% for SOL against −14.4% BTC, with −73.9% asset drawdown. A counterexample is 2023-10-01: +396.8% for SOL versus +56.0% BTC. These are contrasting examples from the complete table, not independent future scenarios. A first-of-month start is the frozen sample design, not a suggested buying schedule.
Compare terminal return with interim drawdown in each row. Daily-open paths can understate intraday harm; fees, spreads, slippage, tax, staking and leverage are excluded. The complete input CSV and exclusion ledger are available for independent recalculation.
| UTC start | SOL 90d | BTC 90d | SOL − BTC | SOL path drawdown |
|---|---|---|---|---|
| 2021-10-01 | +20.7% | +6.0% | +14.7 pp | −39.9% |
| 2021-11-01 | −52.5% | −37.7% | -14.8 pp | −65.4% |
| 2021-12-01 | −52.2% | −24.2% | -28.0 pp | −64.5% |
| 2022-01-01 | −27.8% | −1.5% | -26.2 pp | −56.0% |
| 2022-02-01 | −9.9% | +0.0% | -9.9 pp | −38.2% |
| 2022-03-01 | −54.9% | −31.7% | -23.1 pp | −69.9% |
| 2022-04-01 | −72.3% | −55.8% | -16.5 pp | −79.1% |
| 2022-05-01 | −50.5% | −36.8% | -13.7 pp | −69.2% |
| 2022-06-01 | −29.2% | −36.2% | +7.0 pp | −37.5% |
| 2022-07-01 | −1.6% | −2.7% | +1.1 pp | −34.7% |
| 2022-08-01 | −22.4% | −10.7% | -11.7 pp | −39.9% |
| 2022-09-01 | −57.6% | −18.0% | -39.6 pp | −68.4% |
| 2022-10-01 | −71.0% | −14.4% | -56.6 pp | −73.9% |
| 2022-11-01 | −20.0% | +15.9% | -35.8 pp | −73.9% |
| 2022-12-01 | +54.4% | +34.8% | +19.6 pp | −32.6% |
| 2023-01-01 | +112.1% | +72.1% | +40.1 pp | −34.0% |
| 2023-02-01 | −8.3% | +21.4% | -29.6 pp | −34.0% |
| 2023-03-01 | −6.0% | +19.9% | -25.8 pp | −24.2% |
| 2023-04-01 | −14.9% | +7.0% | -21.9 pp | −42.8% |
| 2023-05-01 | +10.7% | +0.4% | +10.3 pp | −36.5% |
| 2023-06-01 | +4.7% | +1.9% | +2.8 pp | −33.6% |
| 2023-07-01 | +5.9% | −11.3% | +17.3 pp | −35.5% |
| 2023-08-01 | +38.4% | +18.1% | +20.3 pp | −29.7% |
| 2023-09-01 | +200.5% | +45.9% | +154.5 pp | −21.1% |
| 2023-10-01 | +396.8% | +56.0% | +340.8 pp | −21.1% |
| 2023-11-01 | +164.7% | +25.0% | +139.7 pp | −30.7% |
| 2023-12-01 | +100.7% | +65.5% | +35.2 pp | −30.7% |
| 2024-01-01 | +90.9% | +64.6% | +26.3 pp | −23.7% |
| 2024-02-01 | +30.7% | +42.5% | -11.8 pp | −37.4% |
| 2024-03-01 | +33.9% | +10.7% | +23.3 pp | −37.4% |
| 2024-04-01 | −30.7% | −14.4% | -16.3 pp | −37.4% |
| 2024-05-01 | +44.0% | +10.1% | +34.0 pp | −31.5% |
| 2024-06-01 | −15.5% | −12.1% | -3.4 pp | −29.8% |
| 2024-07-01 | +6.9% | +4.9% | +2.0 pp | −32.4% |
| 2024-08-01 | +4.5% | +12.5% | -8.0 pp | −27.2% |
| 2024-09-01 | +79.8% | +65.3% | +14.5 pp | −13.7% |
| 2024-10-01 | +24.5% | +48.0% | -23.5 pp | −29.7% |
| 2024-11-01 | +35.3% | +47.6% | -12.3 pp | −29.7% |
| 2024-12-01 | −37.6% | −12.5% | -25.1 pp | −48.3% |
| 2025-01-01 | −34.2% | −11.8% | -22.4 pp | −54.8% |
| 2025-02-01 | −34.9% | −5.8% | -29.1 pp | −54.5% |
| 2025-03-01 | +12.5% | +25.2% | -12.7 pp | −41.0% |
| 2025-04-01 | +23.1% | +31.3% | -8.1 pp | −28.3% |
| 2025-05-01 | +23.0% | +25.3% | -2.3 pp | −28.3% |
| 2025-06-01 | +31.1% | +3.6% | +27.5 pp | −23.0% |
| 2025-07-01 | +36.2% | +4.7% | +31.5 pp | −23.0% |
| 2025-08-01 | +12.6% | −5.0% | +17.5 pp | −28.2% |
| 2025-09-01 | −32.3% | −16.1% | -16.1 pp | −48.4% |
| 2025-10-01 | −40.9% | −23.5% | -17.4 pp | −49.1% |
| 2025-11-01 | −37.1% | −22.8% | -14.3 pp | −37.2% |
| 2025-12-01 | −36.8% | −25.9% | -10.9 pp | −46.9% |
| 2026-01-01 | −33.3% | −22.1% | -11.2 pp | −46.9% |
| 2026-02-01 | −20.7% | −0.6% | -20.0 pp | −26.2% |
| 2026-03-01 | −2.7% | +9.7% | -12.4 pp | −17.9% |
| 2026-04-01 | −9.6% | −11.8% | +2.1 pp | −36.1% |
| 2026-05-01 | −11.3% | −16.2% | +4.9 pp | −36.1% |
| 2026-06-01 | +28.1% | +6.2% | +21.9 pp | −24.5% |
Can SOL’s deep sampled book guarantee your own exit?
A quoted SOL price does not guarantee your order can buy or exit there. This report has one dated Binance order-book sample, separate from historical daily turnover; execution requires a fresh route-specific book and cost check.
The historical SOL/USDT Binance spot candles show $230,400,059 median daily quote turnover across 30 complete UTC days. This is a transaction-flow measure, not cash available at a specific bid or ask. It also excludes other exchanges and market-maker obligations.
A separate CoinNudge Binance book sample observed at 2026-09-26T08:35:34.380Z shows 0.83 bps quoted spread and $8,960,724 returned depth within ±1% of mid. The modelled $10,000 buy slippage is 0.41 bps before fees and latency. Recheck the live book and your actual venue; this is one snapshot, not guaranteed execution.
Before an actual SOL order, match the pair, venue and observation time, then estimate the buy from asks and the planned exit from bids at the intended size. Add fees and any transfer costs; one basis point is 0.01%. If the returned levels cannot fill the size, or access/data is delayed, reduce the planned exposure or wait for adequate evidence—not extrapolate the historical turnover into depth.
| Liquidity or execution measure | Dated observed value | Limit |
|---|---|---|
| 30-day Binance spot median daily quote turnover | $230,400,059 | 30 complete archived UTC days; turnover ≠ executable depth |
| Sampled bid/ask spread | 0.83 bps | One Binance book observation; can change by the second |
| Visible depth within ±1% of mid | $8,960,724 | Returned 500 levels per side only |
| Simulated $10k buy / sell slippage | 0.41 / 0.41 bps | Excludes fees, latency and later book changes |
Verify: Frozen top-30 order-book source · Current market-depth research
Do Solana activity headlines establish SOL holder economics?
SOL community activity does not establish how much value accrues to SOL owners. For a holding thesis, use discussion to locate fee-distribution, validator or user-payment evidence rather than treating transactions or meme launches as income.
A third-party directory showed about 46,370 X mentions over 7 days and 634 Reddit mentions over 30 days for SOL at the September 26 review. Those are different time windows and may include promotions, bots or ticker collisions. They are not unique people, buyers, monthly search volume or a measure of tokenholder rights.
The underlying social response was not frozen in this release. These report-time directory figures cannot now be independently replayed and are not used as a quantitative test of fundamental demand or current community size.
SOL has broad discussion across X, Telegram and Reddit, unlike a one-platform spike. The important question inside that volume is whether users pay enough in SOL to matter after fee distribution and issuance, not simply whether the chain hosts many transactions or meme launches.
To use SOL discussion constructively, choose one factual claim, follow its direct source, note the date and beneficiary, and compare it with the rights and supply checks in this report. An unsupported promotion remains attention evidence; it is not converted into a holder-benefit claim or buying score.
Verify: Cross-platform social directory · CoinGecko short-window search attention · Solana transaction fee documentation · Solana staking and inflation guide · Solana fee structure
Which fee, staking and exit checks support holding SOL?
There is no unconditional yes from this evidence. A defensible SOL holding case weighs sustained user-paid network fee demand and staking economics against issuance, validator concentration and the historically large drawdowns visible in the matched paths. The last frozen 90-day return was +62.8%, while the median of 57 earlier monthly-start windows was −2.7%; 24/57 beat BTC. These overlapping historical paths describe risk, not the chance of a profitable hold from today.
Evidence that would strengthen a holding thesis: Sustained user-paid fee demand, healthy network operation and verifiable net supply economics improve while the token retains deep execution liquidity. Evidence that would weaken or end it: Activity is dominated by low-value churn or fees captured outside SOL, while issuance or concentration offsets demand and price remains highly drawdown-prone.
A holder should state a time horizon, position size, acceptable drawdown and specific facts that would trigger a reassessment. Revision trigger for this report: A change in fee distribution, issuance policy or validator concentration needs a new dated assessment. The checklist is not a personal recommendation, target price or promise that the next 90 days resemble a prior cohort.
Decide whether the intended SOL exposure is liquid spot or delegated stake before using the history. For spot, check current sell depth and costs; for delegation, also verify commission, stake-account status and deactivation requirements. If a position needs immediate liquidity, a cooling-down stake account cannot be counted as immediately sellable SOL. Review the plan when fee allocation or issuance rules change, not solely when a social narrative improves.
| Holding decision check | Evidence to verify | Why it matters |
|---|---|---|
| Tokenholder benefit | Pays network transaction fees; can hold the native asset | No automatic claim on all application profits |
| Future tradable supply | Official allocation dates and actual transfers | Provider float alone is not a sell forecast |
| Ability to exit | Fresh bid/ask depth plus fees and latency | Historical turnover is not a fill guarantee |
| Opportunity cost versus BTC | 57 complete historical paired starts plus current common window | Absolute gains can still lag BTC |
| Thesis invalidation | A change in fee distribution, issuance policy or validator concentration needs a new dated assessment. | A stated reason to reassess is more useful than an indefinite hold slogan |
Verify: Frozen SOL/BTC price study · Complete SOL monthly observation ledger · Solana transaction fee documentation · Solana staking and inflation guide · Solana fee structure
How can you reproduce SOL spot returns without adding assumed staking yield?
Reproduce SOL's spot results from the matched asset/BTC daily inputs, complete observation CSV, exclusions and frozen JSON below. Keep the original calculation version and cutoff: the October 3, 2026 edit clarifies decisions and subquestions, not a recalculation or a fresh market release.
Calculation coin-profile-spot-paths-1.0; historical cutoff 2026-09-25 UTC. The archived candle ledger preserves event_time, observed_at and ingested_at. Historical fills may have been collected retrospectively; this study does not claim every bar was available to CoinNudge on its original event date.
Recent returns use the same UTC daily-open start and endpoint for SOL and BTC with every intermediate day present. The monthly study buys at the first-day open and exits at the day-90 open, with 91 complete daily opens per pair; maximum drawdown is min(path / prior running peak − 1). It assumes no costs or dividends. The asset and BTC daily input CSVs enable independent numerical replay. Candidate and exclusion counts, input SHA-256 2ea4dd2770631c81acf2dc4911bfd0ed6d1079c5f348bc9b37abf726827c9ea0 of the complete normalized archive objects, and output SHA-256 f7598d14526a3240823f36d036a68bf078785b17910ebfa226c035aaf58caeb2 of the research result identify the frozen release; the manifest separately hashes each downloadable file.
Supply comes from a separate CoinGecko 2026-09-26T08:35:30.000Z observation; the separate book package was generated at 2026-09-26T08:37:46.983Z, while the SOL row was observed at 2026-09-26T08:35:34.380Z. Neither is silently inserted as information known to historical cohort investors. No causal claim links community activity or project usage to later return.
| Reproducible file | Contents | Time/interpretation boundary |
|---|---|---|
| Research JSON | /research-data/coin-profiles/2026-09-26-v1/sol.json | Calculation version, summary and full paired cohort |
| Observation CSV | /research-data/coin-profiles/2026-09-26-v1/sol-monthly-observations.csv | 57 matched monthly starts |
| Asset daily inputs | /research-data/coin-profiles/2026-09-26-v1/sol-daily-inputs.csv | Event, observation and ingestion dates |
| BTC daily inputs | /research-data/coin-profiles/2026-09-26-v1/btc-daily-inputs.csv | Matched BTC daily opens and provenance |
| Excluded starts | /research-data/coin-profiles/2026-09-26-v1/sol-exclusions.csv | 0 missing pairs; header retained if zero |
| Supply source | /research-data/coin-profiles/2026-09-26-v1/coingecko-supply-source.json | Dated provider fields, not a historical feature |
| Order-book source | /research-data/coin-profiles/2026-09-26-v1/orderbook-source.json | Sampled current market, may omit this asset |
Verify: CoinNudge frozen spot-path research · Complete monthly observation ledger · Daily historical input ledger · Matched BTC daily input ledger · Frozen CoinGecko supply response · Dated order-book source · Social directory and limitations · Solana transaction fee documentation · Solana staking and inflation guide · Solana fee structure
Take the next step with this evidence.
Choose ongoing Telegram monitoring or inspect structured data in your own research workflow.
Receive qualifying events in Telegram.
Use the ready-made alert checklist, message explanations and daily briefing. Check the supported categories and coins before subscribing; every Research page is not a separate alert category.
Check the alert list · View alert plans
Inspect the data before choosing a pack.
Prepared research packs supply scoped features, separate outcomes where available and quality flags. Buy a fixed edition once and download directly; API use is optional.
Check data pack samples · Explore the full data catalog · Compare data plans
Each purchased pack includes its specified fields and published date range. This page's full dataset is not automatically included. Other data families require coverage, date, field and source-use confirmation before purchase. Telegram Pro is a separate 30-day service; historical packs are one-time purchases.
Frequently asked questions
What is Solana (SOL) used for?
SOL is the native asset of the Solana blockchain, used for network fees and staking; it is not a direct claim on the revenue of every application built there. This answers the token's documented role, not whether its price is attractive.
Is SOL worth holding?
There is no unconditional yes in this dated research. A defensible SOL holding case weighs sustained user-paid network fee demand and staking economics against issuance, validator concentration and the historically large drawdowns visible in the matched paths. The historical 57 monthly 90-day starts overlap, and 24/57 beat BTC; this is not a future success rate. Check your own horizon, loss limit and live evidence before deciding.
Is SOL a good coin to buy now?
This report is not a personalized buy call. The latest dated 90-day SOL path was +62.8% versus BTC +40.5%, but only 24/57 earlier 90-day monthly starts beat BTC and rights, supply and execution still matter.
How has SOL performed over 7, 30, 90 and 365 days?
The matched Binance spot daily-open returns are 7 days +15.2%; 30 days +21.2%; 90 days +62.8%; 365 days −44.7% through September 25, 2026. These are dated historical windows, not live quotes.
Does every Solana app fee go to SOL holders?
No. Network base and priority fees have documented distribution rules; app charges belong to their own contracts or operators unless a separate mechanism exists.
Is staking SOL risk-free yield?
No. Rewards vary with issuance, commission and operation, while SOL market price can fall.
Is SOL supply capped?
The frozen provider response does not report a max-supply figure. Evaluate actual issuance and fee burn instead of inventing a cap.
Can I reproduce this SOL study?
Yes. The page exposes every 57 matched 90-day start, the daily input CSV, exclusions, version and hashes. The windows overlap, so observed counts are not independent future probabilities.
Does SOL trading volume guarantee easy execution?
No. The 30-day Binance spot turnover is separate from one sampled order book. At the cited snapshot the returned ±1% book depth was $8,960,724; later depth and actual fills can differ.
Can the SOL historical return table tell me my staking return?
No. It contains unstaked, unlevered spot paths before costs. A staking comparison needs actual credited rewards, commission and withdrawal timing over the same dates.
What are SOL tokenomics?
SOL is not capped: protocol issuance funds staking rewards under a declining schedule. It is used for transaction fees and staking; reward yield differs from inflation and depends on participation and validator commission. SOL does not convey company equity.
Sources and verification
- CoinNudge frozen spot-path researchMatched daily-open returns, full cohort and audit hashes.
- Complete monthly observation ledgerEvery eligible 90-day matched start.
- Daily historical input ledgerActual daily inputs with observation and ingestion time.
- Matched BTC daily input ledgerThe same-date BTC opens used in every paired return and drawdown.
- Frozen CoinGecko supply responseProvider-defined current float, total and maximum supply at its own timestamp.
- Dated order-book sourceSampled Binance books for covered markets; not the entire exchange.
- Social directory and limitationsDirectional 7-day X and 30-day Reddit mention counts; bot and promotion filtering unverified.
- Solana transaction fee documentationNative SOL fee requirement and distribution scope.
- Solana staking and inflation guideNetwork reward and inflation mechanics.
- Solana fee structureBase and priority fee recipients.
Monitor SOL market changes without treating a dated report as a current order.
Use this report for the thesis and risk checks, then verify current liquidity and any alert separately.
Preview Telegram alert coverage