Single-asset evidence report · By CoinNudge Research · · Guide updated 2026-10-03 · 20 min read
What is BNB coin, and is it worth holding?
BNB is the native gas and staking asset of BNB Chain and is also used in some Binance ecosystem products. Burn mechanisms reduce supply, but do not promise price appreciation. For a holding decision, a BNB holding case should combine verified current network demand and completed burns with exchange concentration, governance and actual exit liquidity; a historical burn target is not sufficient. In the frozen Binance spot daily-open window ending September 25, 2026, BNB returned +36.8% versus BTC +40.5%; across 57 earlier monthly starts, its median was +0.3% and 29/57 beat BTC. Overlapping history is not a future win rate or personal buy call.
Inspect all historical starts · Check current market context
What should investors know about BNB?
- BNB gained +36.8% in the last frozen 90-day window; this differs from its historical monthly-start median +0.3%.
- 29/57 complete historical 90-day starts beat BTC, while 36/57 had a deeper daily-open drawdown.
- A BNB holding case should combine verified current network demand and completed burns with exchange concentration, governance and actual exit liquidity; a historical burn target is not sufficient.
What does BNB do on BNB Chain and in exchange products?
BNB is the native gas and staking asset of BNB Chain and is also used in some Binance ecosystem products. Burn mechanisms reduce supply, but do not promise price appreciation.
BNB can be used for chain gas and eligible exchange products, but those uses have different rules and beneficiaries. A burn changes units outstanding; it does not send each wallet exchange revenue.
A holding review needs completed burn evidence, actual token use, account-specific benefits where relevant and an exit plan. The 57 historical matched starts below test spot prices, not future burn success or the profit of a staking/discount programme.
| BNB at a glance | Dated evidence | How to read it |
|---|---|---|
| Documented token role | Can pay BNB Chain gas and hold/delegate under relevant network rules | Not an automatic claim on every project activity |
| Last frozen 90-day spot return | +36.8% | BTC on the same UTC dates: +40.5% |
| Historical 90-day monthly median | +0.3% | 57 overlapping complete starts, not a forecast |
| Current circulating supply | 133,159,801 | CoinGecko response updated 2026-09-26T10:12:20.000Z |
Verify: BNB Chain token overview · BNB Chain BEP-95
Do BNB holders receive Binance revenue or validator rewards?
Holding BNB does not make you a Binance shareholder or entitled to a universal exchange-revenue dividend. Network delegation and account-level product benefits require their own rules.
A validator or delegator may receive eligible rewards; an exchange customer may receive a discount under current account terms. A passive wallet owner cannot assume both streams automatically apply. Check the recipient, conditions and any lock or custody requirement before including a benefit in expected returns.
Use the rights table to separate the native asset from products offered around it. When a term changes, reassess the benefit rather than keeping an old percentage in the investment thesis.
| Who owns what | Documented role or participation | What cannot be inferred |
|---|---|---|
| BNB holder | Can pay BNB Chain gas and hold/delegate under relevant network rules | No Binance corporate equity or universal exchange-revenue dividend |
| Chain validator/delegator | May participate in network security under validator-specific terms | Rewards and lockups are not risk-free |
| Exchange customer | May receive account-specific product benefits | Terms can change and are not an inherent right of every BNB wallet |
Verify: BNB Chain token overview · BNB Chain BEP-95 · BNB Smart Chain staking and reward recipients
Is holding BNB for an exchange discount worth the price exposure?
Only a user-specific cost comparison can answer that. A trading-fee benefit applies under the current exchange's account and product rules; it is not a universal right of every BNB wallet and need not outweigh a loss on the BNB held.
Estimate the fees your own eligible activity would otherwise pay, subtract the costs of acquiring, holding and eventually selling the required BNB, and stress the token's price path. Keep staking rewards and gas use separate from that discount. No discount rate or current eligibility is assumed in this report.
If the live rules do not confirm your account qualifies, count the proposed benefit as unavailable until verified. The frozen 57-window price comparison excludes account benefits and costs, so its returns cannot be presented as the net profit of this discount strategy.
Do BNB Auto-Burn and chain activity create holder value?
BNB has two different supply-reduction routes: periodic Auto-Burn and activity-linked BEP-95 gas-fee burn. Neither is an automatic revenue dividend.
BNB Chain documents the Auto-Burn mechanism separately from BEP-95, which burns a governance-set portion of gas fees. A historically announced target of 100 million remaining units is a supply policy, not a current circulating-supply quote. Reconcile actual on-chain supply and each completed burn rather than subtracting a promised future amount from today’s price.
BNB Chain usage can create gas demand, while exchange-specific discounts or campaigns have their own terms. Do not count all DeFi app revenue, exchange revenue and gas fees as income of a passive BNB holder. Project-level activity needs transaction and fee evidence, net of changing protocol parameters.
For a burn-based holding case, first reconcile distinct completed unit reductions and then evaluate the demand that remains at the current price. A lower supply count alone does not set a price when demand, custody concentration or exit liquidity changes. The older BEP-95 article explains the design; it does not certify today's burn ratio or every later governance setting.
BNB's dated price experiment below measures spot returns and drawdown paths, not the causal contribution of project adoption. The release has no independently frozen continuous operating-economics series that completes this value-capture test.
Verify: BNB Chain token overview · BNB Chain BEP-95
How do Auto-Burn and BEP-95 affect the amount of BNB outstanding?
Completed Auto-Burn and BEP-95 burns reduce outstanding BNB through separate mechanisms, but neither a historical maximum nor a future target measures today's float. Existing concentrated inventory remains an independent selling-risk question.
CoinGecko’s separate 2026-09-26T10:12:20.000Z response reports 133,159,801 circulating BNB out of 133,159,798 total and 200,000,000 maximum. These are provider classifications, not an audit of custodian balances or a schedule of future exchange selling.
BNB began with a fixed historical issuance and has supply-reducing burn mechanisms. A 200 million provider maximum-supply field describes original maximum units, not today’s remaining stock. In this frozen provider response circulating exceeds total by about 3 BNB, so those two separately computed fields are not an exact supply ledger. Auto-Burn and BEP-95 operate differently; verify official burn transactions, outstanding supply and any governance change at the same date.
BNB's supply reconciliation follows completed Auto-Burn and BEP-95 transactions over common dates, avoiding duplicate units across summaries. The historical 200-million issuance field and 100-million policy target are not current float. The approximately 3-BNB mismatch between provider circulating and total values remains visible; it is not silently repaired into an exact chain ledger. Existing concentrated inventory can be sold without any new mint.
| BNB supply field | Frozen provider value | Reading rule |
|---|---|---|
| Circulating supply | 133,159,801 | CoinGecko provider definition at 2026-09-26T10:12:20.000Z |
| Total supply | 133,159,798 | May differ from circulating and maximum supply |
| Maximum supply | 200,000,000 | Missing is not zero and not equal to total supply |
| Reported circulating / maximum | 66.6% | Not a dated release schedule or tradable-float audit |
Verify: Frozen original supply response · BNB Chain token overview · BNB Chain BEP-95
BNB tokenomics: original issuance, two burns and current float
Completed BNB Auto-Burn and BEP-95 fee burns reduce outstanding units through different mechanisms; neither is a passive-holder dividend. The historical 200-million original supply and 100-million burn target are not current circulating float, and a smaller supply does not guarantee stronger demand or a higher price.
Reconcile completed burn transactions separately, avoid counting the same reduction twice, and compare network gas use and product benefits with the same-period outstanding supply. A provider maximum-supply field cannot replace that reconciliation. BNB ownership is not Binance corporate equity.
| Token-economics dimension | Documented mechanism or attributed claim | What remains unproven / investor implication |
|---|---|---|
| Original versus outstanding supply | The original historical maximum was 200 million BNB; actual outstanding units are lower after completed burns. | Do not use the provider max-supply field as current float. |
| Auto-Burn | BNB Chain describes periodic Auto-Burn with a historical goal of reducing outstanding units toward 100 million. | A future target is not today’s supply or a guaranteed price effect. |
| BEP-95 | A governance-adjustable portion of BNB Chain gas fees is burned as activity occurs. | Separate this mechanism from Auto-Burn to avoid double counting. |
| Use and rights | BNB pays chain gas and has network and product uses under specific terms. | It is not Binance corporate equity or a universal share of app revenue. |
Verify: BNB Chain token overview · BNB Chain BEP-95
Did BNB keep pace with Bitcoin across recent holding periods?
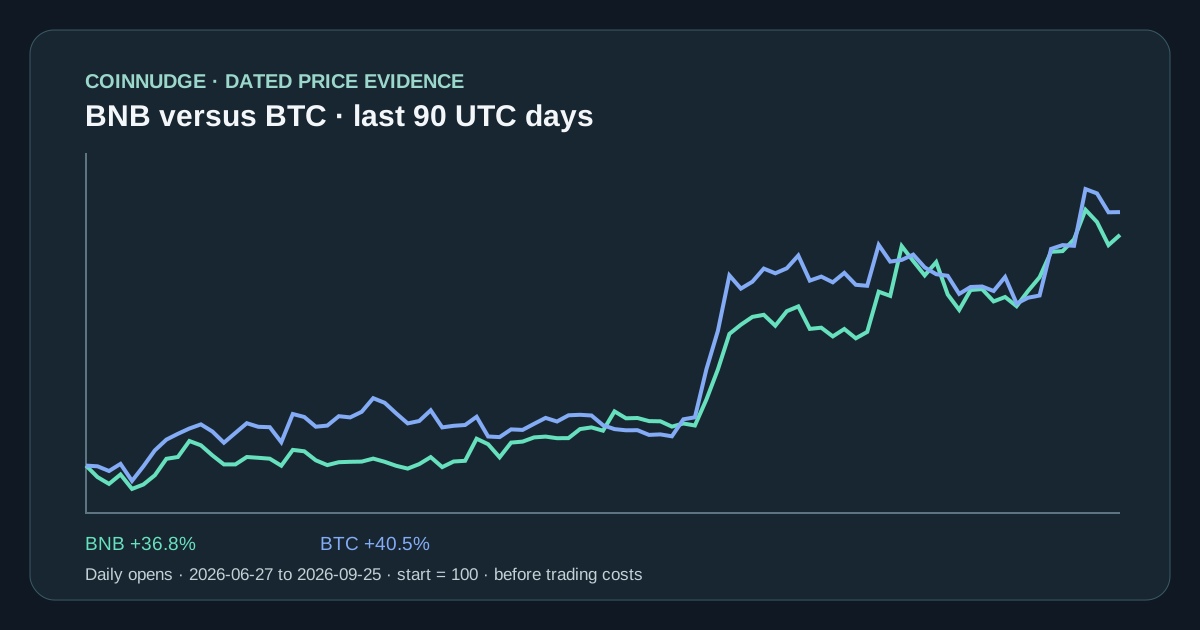
At the September 25 UTC daily-open endpoint, BNB returned +36.8% over 90 days versus BTC +40.5% on exactly the same days. The 365-day BNB path was −23.7% versus BTC −25.5%. These different windows are one dated path each—not five independent tests or a prediction.
The 90-day chart plots all 91 matched UTC daily opens from 2026-06-27 to 2026-09-25, normalized to 100 on the first day. A later CoinGecko price or 24-hour change may differ because the venue, market window and timestamp differ. The table reports the actual shared-start comparison rather than mixing unrelated provider percentages.
| Matched holding window | BNB spot return | BTC spot return | BNB minus BTC / status |
|---|---|---|---|
| 7 days | +5.2% | +10.5% | -5.3 pp |
| 30 days | +11.8% | +7.5% | 4.4 pp |
| 90 days | +36.8% | +40.5% | -3.6 pp |
| 180 days | +27.1% | +27.2% | -0.1 pp |
| 365 days | −23.7% | −25.5% | 1.8 pp |
Verify: Full dated path and methods
Did BNB beat BTC across 57 historical 90-day entry points?
Across the frozen matched 90-day monthly starts, BNB's median return was +0.3% versus BTC +1.9%, and 29/57 starts beat BTC. That is descriptive historical evidence, not a future success probability; the full overlapping sample, dependence check and opposing cases appear below.
We prespecified every first day of a month after the Binance listing had a full prior month through June 2026. Of 57 candidate 90-day starts, 57 had a complete 91-daily-open BNB/BTC pair and 0 were excluded for missing daily opens. The BNB median endpoint was +0.3%, BTC's was +1.9%; BNB beat BTC in 29/57. Those windows overlap and must not be treated as 57 independent win-probability trials.
BNB had a deeper daily-open peak-to-trough drawdown in 36/57 matched windows. The lower 10th-percentile BNB endpoint was −26.2% and the upper 90th percentile +43.3%. Every-third-month sensitivity has only 19 observations and 10 BTC-beating starts; it is a dependence check, not a statistically powered forecast.
The worst BTC-relative start was 2023-01-01: +28.7% for BNB against +72.1% BTC, with −17.1% asset drawdown. A counterexample is 2024-02-01: +92.5% for BNB versus +42.5% BTC. Showing both prevents the current rally or a past collapse from becoming the whole story.
| 90-day monthly cohort measure | BNB | BTC / paired comparison | Interpretation |
|---|---|---|---|
| Complete starts | 57 | 57 | Same UTC dates and 91 daily opens |
| Median endpoint | +0.3% | +1.9% | Not an expected future return |
| 10th / 90th percentile | −26.2% / +43.3% | −24.9% / +47.8% | Descriptive tail range |
| Outperformed BTC | 29/57 | — | Overlapping monthly windows |
| Deeper path drawdown | 36/57 | — | Measured at daily opens only |
| Every-third-month check | 10/19 | — | Small non-overlap sensitivity |
Verify: All matched starts and excluded candidates · Frozen calculation contract
Which BNB entry months beat BTC, and what interim losses did they show?
Both winning and losing BNB windows are shown: all 57 eligible same-date BNB/BTC 90-day observations are visible chronologically below. The worst BTC-relative start was 2023-01-01: +28.7% for BNB against +72.1% BTC, with −17.1% asset drawdown. A counterexample is 2024-02-01: +92.5% for BNB versus +42.5% BTC. These are contrasting examples from the complete table, not independent future scenarios. A first-of-month start is the frozen sample design, not a suggested buying schedule.
Compare terminal return with interim drawdown in each row. Daily-open paths can understate intraday harm; fees, spreads, slippage, tax, staking and leverage are excluded. The complete input CSV and exclusion ledger are available for independent recalculation.
| UTC start | BNB 90d | BTC 90d | BNB − BTC | BNB path drawdown |
|---|---|---|---|---|
| 2021-10-01 | +32.8% | +6.0% | +26.7 pp | −21.3% |
| 2021-11-01 | −25.8% | −37.7% | +12.0 pp | −45.2% |
| 2021-12-01 | −36.4% | −24.2% | -12.2 pp | −43.2% |
| 2022-01-01 | −16.1% | −1.5% | -14.6 pp | −32.8% |
| 2022-02-01 | +4.1% | +0.0% | +4.1 pp | −17.7% |
| 2022-03-01 | −22.7% | −31.7% | +9.0 pp | −40.3% |
| 2022-04-01 | −48.8% | −55.8% | +7.0 pp | −56.3% |
| 2022-05-01 | −22.1% | −36.8% | +14.7 pp | −51.1% |
| 2022-06-01 | −10.9% | −36.2% | +25.3 pp | −38.6% |
| 2022-07-01 | +28.2% | −2.7% | +30.9 pp | −20.2% |
| 2022-08-01 | +7.4% | −10.7% | +18.1 pp | −20.2% |
| 2022-09-01 | +5.8% | −18.0% | +23.7 pp | −28.4% |
| 2022-10-01 | −13.5% | −14.4% | +0.8 pp | −34.8% |
| 2022-11-01 | −2.7% | +15.9% | -18.5 pp | −34.8% |
| 2022-12-01 | +0.3% | +34.8% | -34.5 pp | −23.1% |
| 2023-01-01 | +28.7% | +72.1% | -43.4 pp | −17.1% |
| 2023-02-01 | +5.2% | +21.4% | -16.2 pp | −17.1% |
| 2023-03-01 | +3.4% | +19.9% | -16.5 pp | −12.4% |
| 2023-04-01 | −26.4% | +7.0% | -33.4 pp | −33.7% |
| 2023-05-01 | −28.1% | +0.4% | -28.6 pp | −31.7% |
| 2023-06-01 | −26.0% | +1.9% | -27.9 pp | −31.5% |
| 2023-07-01 | −10.6% | −11.3% | +0.8 pp | −19.5% |
| 2023-08-01 | −5.8% | +18.1% | -23.9 pp | −17.2% |
| 2023-09-01 | +4.9% | +45.9% | -41.0 pp | −11.6% |
| 2023-10-01 | +46.2% | +56.0% | -9.8 pp | −11.6% |
| 2023-11-01 | +37.3% | +25.0% | +12.3 pp | −11.6% |
| 2023-12-01 | +82.2% | +65.5% | +16.7 pp | −9.8% |
| 2024-01-01 | +92.6% | +64.6% | +28.0 pp | −19.8% |
| 2024-02-01 | +92.5% | +42.5% | +50.0 pp | −19.8% |
| 2024-03-01 | +49.2% | +10.7% | +38.5 pp | −19.8% |
| 2024-04-01 | −6.0% | −14.4% | +8.4 pp | −20.2% |
| 2024-05-01 | −0.7% | +10.1% | -10.8 pp | −31.0% |
| 2024-06-01 | −9.7% | −12.1% | +2.4 pp | −34.7% |
| 2024-07-01 | +3.2% | +4.9% | -1.7 pp | −22.9% |
| 2024-08-01 | +5.2% | +12.5% | -7.4 pp | −19.5% |
| 2024-09-01 | +22.9% | +65.3% | -42.4 pp | −10.6% |
| 2024-10-01 | +22.4% | +48.0% | -25.6 pp | −13.3% |
| 2024-11-01 | +15.9% | +47.6% | -31.7 pp | −13.3% |
| 2024-12-01 | −10.0% | −12.5% | +2.5 pp | −24.0% |
| 2025-01-01 | −13.9% | −11.8% | -2.1 pp | −27.1% |
| 2025-02-01 | −11.5% | −5.8% | -5.7 pp | −23.7% |
| 2025-03-01 | +14.8% | +25.2% | -10.4 pp | −14.8% |
| 2025-04-01 | +8.3% | +31.3% | -23.0 pp | −10.3% |
| 2025-05-01 | +34.2% | +25.3% | +9.0 pp | −10.3% |
| 2025-06-01 | +31.0% | +3.6% | +27.4 pp | −12.7% |
| 2025-07-01 | +51.2% | +4.7% | +46.5 pp | −12.7% |
| 2025-08-01 | +41.4% | −5.0% | +46.4 pp | −19.1% |
| 2025-09-01 | +1.8% | −16.1% | +17.9 pp | −36.5% |
| 2025-10-01 | −15.5% | −23.5% | +8.0 pp | −36.8% |
| 2025-11-01 | −20.2% | −22.8% | +2.5 pp | −24.5% |
| 2025-12-01 | −29.5% | −25.9% | -3.6 pp | −38.5% |
| 2026-01-01 | −28.6% | −22.1% | -6.5 pp | −38.5% |
| 2026-02-01 | −21.3% | −0.6% | -20.6 pp | −25.3% |
| 2026-03-01 | +4.2% | +9.7% | -5.5 pp | −14.2% |
| 2026-04-01 | −9.4% | −11.8% | +2.4 pp | −23.3% |
| 2026-05-01 | −7.1% | −16.2% | +9.1 pp | −24.0% |
| 2026-06-01 | −2.5% | +6.2% | -8.7 pp | −23.1% |
Is BNB spot turnover the same as executable order-book depth?
A quoted BNB price does not guarantee your order can buy or exit there. This report has one dated Binance order-book sample, separate from historical daily turnover; execution requires a fresh route-specific book and cost check.
The historical BNB/USDT Binance spot candles show $100,538,073 median daily quote turnover across 30 complete UTC days. This is a transaction-flow measure, not cash available at a specific bid or ask. It also excludes other exchanges and market-maker obligations.
A separate CoinNudge Binance book sample observed at 2026-09-26T10:11:09.500Z shows 0.13 bps quoted spread and $6,336,529 returned depth within ±1% of mid. The modelled $10,000 buy slippage is 0.11 bps before fees and latency. Recheck the live book and your actual venue; this is one snapshot, not guaranteed execution.
Before an actual BNB order, match the pair, venue and observation time, then estimate the buy from asks and the planned exit from bids at the intended size. Add fees and any transfer costs; one basis point is 0.01%. If the returned levels cannot fill the size, or access/data is delayed, reduce the planned exposure or wait for adequate evidence—not extrapolate the historical turnover into depth.
| Liquidity or execution measure | Dated observed value | Limit |
|---|---|---|
| 30-day Binance spot median daily quote turnover | $100,538,073 | 30 complete archived UTC days; turnover ≠ executable depth |
| Sampled bid/ask spread | 0.13 bps | One Binance book observation; can change by the second |
| Visible depth within ±1% of mid | $6,336,529 | Returned 500 levels per side only |
| Simulated $10k buy / sell slippage | 0.11 / 0.06 bps | Excludes fees, latency and later book changes |
Verify: Frozen top-30 order-book source · Current market-depth research
Why is “BNB burns, so its price must rise” incomplete?
“BNB burns, so price must rise” is not supported by the price study. Burns describe a supply route, while demand, ownership concentration and execution conditions can move independently.
Search-trending lists and public discussions show attention to BNB at the September 26 review. The cited lists are dynamic, and this release did not freeze a defensible unique-person or social-mention count. Attention is not a count of buyers, tokenholder rights or durable usage.
The popular “BNB always rises because it burns” claim confuses supply mechanics with price formation. Compare actual net units removed, chain demand, exchange concentration and broader market conditions.
To use BNB discussion constructively, choose one factual claim, follow its direct source, note the date and beneficiary, and compare it with the rights and supply checks in this report. An unsupported promotion remains attention evidence; it is not converted into a holder-benefit claim or buying score.
Verify: Cross-platform social directory · CoinGecko short-window search attention · BNB Chain token overview · BNB Chain BEP-95
When does a BNB holding thesis survive supply and concentration risk?
There is no unconditional yes from this evidence. A BNB holding case should combine verified current network demand and completed burns with exchange concentration, governance and actual exit liquidity; a historical burn target is not sufficient. The last frozen 90-day return was +36.8%, while the median of 57 earlier monthly-start windows was +0.3%; 29/57 beat BTC. These overlapping historical paths describe risk, not the chance of a profitable hold from today.
Evidence that would strengthen a holding thesis: Verified chain usage and token-specific utility remain strong while completed burns reduce outstanding supply and execution depth stays healthy. Evidence that would weaken or end it: Use weakens, exchange-linked concentration rises, or marketing cites burn amounts without measurable token demand.
A holder should state a time horizon, position size, acceptable drawdown and specific facts that would trigger a reassessment. Revision trigger for this report: A change to Auto-Burn, BEP-95 fraction, validator economics or exchange benefits requires a new review. The checklist is not a personal recommendation, target price or promise that the next 90 days resemble a prior cohort.
A BNB candidate should pass separate checks for completed burns, current use and its actual trading route. If the rationale is mainly a personal exchange discount, compare the benefit you qualify for with the capital tied up and price risk rather than valuing an unavailable public headline offer. Unreconciled burn totals or changing account terms trigger review; poor live exit depth triggers waiting, not a burn-based conviction trade.
| Holding decision check | Evidence to verify | Why it matters |
|---|---|---|
| Tokenholder benefit | Can pay BNB Chain gas and hold/delegate under relevant network rules | No Binance corporate equity or universal exchange-revenue dividend |
| Future tradable supply | Official allocation dates and actual transfers | Provider float alone is not a sell forecast |
| Ability to exit | Fresh bid/ask depth plus fees and latency | Historical turnover is not a fill guarantee |
| Opportunity cost versus BTC | 57 complete historical paired starts plus current common window | Absolute gains can still lag BTC |
| Thesis invalidation | A change to Auto-Burn, BEP-95 fraction, validator economics or exchange benefits requires a new review. | A stated reason to reassess is more useful than an indefinite hold slogan |
Verify: Frozen BNB/BTC price study · Complete BNB monthly observation ledger · BNB Chain token overview · BNB Chain BEP-95
How were BNB burn claims kept separate from the price experiment?
Reproduce BNB's spot results from the matched asset/BTC daily inputs, complete observation CSV, exclusions and frozen JSON below. Keep the original calculation version and cutoff: the October 3, 2026 edit clarifies decisions and subquestions, not a recalculation or a fresh market release.
Calculation hot-coin-spot-paths-1.0; historical cutoff 2026-09-25 UTC. The archived candle ledger preserves event_time, observed_at and ingested_at. Historical fills may have been collected retrospectively; this study does not claim every bar was available to CoinNudge on its original event date.
Recent returns use the same UTC daily-open start and endpoint for BNB and BTC with every intermediate day present. The monthly study buys at the first-day open and exits at the day-90 open, with 91 complete daily opens per pair; maximum drawdown is min(path / prior running peak − 1). It assumes no costs or dividends. The asset and BTC daily input CSVs enable independent numerical replay. Candidate and exclusion counts, input SHA-256 f524a51a81d012be37a4c374b46ad756838d7723c7b90408c61e580345aa7b5e of the complete normalized archive objects, and output SHA-256 135b215f7ddc2b6fc34a861d990b1608c4ace183c8d0b344495b2163ff4fae45 of the research result identify the frozen release; the manifest separately hashes each downloadable file.
Supply comes from a separate CoinGecko 2026-09-26T10:12:20.000Z observation; the separate book package was generated at 2026-09-26T10:14:13.653Z, while the BNB row was observed at 2026-09-26T10:11:09.500Z. Neither is silently inserted as information known to historical cohort investors. No causal claim links community activity or project usage to later return.
| Reproducible file | Contents | Time/interpretation boundary |
|---|---|---|
| Research JSON | /research-data/hot-coin-profiles/2026-09-26-v1/bnb.json | Calculation version, summary and full paired cohort |
| Observation CSV | /research-data/hot-coin-profiles/2026-09-26-v1/bnb-monthly-observations.csv | 57 matched monthly starts |
| Asset daily inputs | /research-data/hot-coin-profiles/2026-09-26-v1/bnb-daily-inputs.csv | Event, observation and ingestion dates |
| BTC daily inputs | /research-data/hot-coin-profiles/2026-09-26-v1/btc-daily-inputs.csv | Matched BTC daily opens and provenance |
| Excluded starts | /research-data/hot-coin-profiles/2026-09-26-v1/bnb-exclusions.csv | 0 missing pairs; header retained if zero |
| Supply source | /research-data/hot-coin-profiles/2026-09-26-v1/coingecko-supply-source.json | Dated provider fields, not a historical feature |
| Order-book source | /research-data/hot-coin-profiles/2026-09-26-v1/orderbook-source.json | Sampled current market, may omit this asset |
Verify: CoinNudge frozen spot-path research · Complete monthly observation ledger · Daily historical input ledger · Matched BTC daily input ledger · Frozen CoinGecko supply response · Dated order-book source · Social directory and limitations · BNB Chain token overview · BNB Chain BEP-95
Take the next step with this evidence.
Choose ongoing Telegram monitoring or inspect structured data in your own research workflow.
Receive qualifying events in Telegram.
Use the ready-made alert checklist, message explanations and daily briefing. Check the supported categories and coins before subscribing; every Research page is not a separate alert category.
Check the alert list · View alert plans
Inspect the data before choosing a pack.
Prepared research packs supply scoped features, separate outcomes where available and quality flags. Buy a fixed edition once and download directly; API use is optional.
Check data pack samples · Explore the full data catalog · Compare data plans
Each purchased pack includes its specified fields and published date range. This page's full dataset is not automatically included. Other data families require coverage, date, field and source-use confirmation before purchase. Telegram Pro is a separate 30-day service; historical packs are one-time purchases.
Frequently asked questions
What is BNB coin (BNB Chain) used for?
BNB is the native gas and staking asset of BNB Chain and is also used in some Binance ecosystem products. Burn mechanisms reduce supply, but do not promise price appreciation. This answers the token's documented role, not whether its price is attractive.
Is BNB worth holding?
There is no unconditional yes in this dated research. A BNB holding case should combine verified current network demand and completed burns with exchange concentration, governance and actual exit liquidity; a historical burn target is not sufficient. The historical 57 monthly 90-day starts overlap, and 29/57 beat BTC; this is not a future success rate. Check your own horizon, loss limit and live evidence before deciding.
Is BNB a good coin to buy now?
This report is not a personalized buy call. The latest dated 90-day BNB path was +36.8% versus BTC +40.5%, but only 29/57 earlier 90-day monthly starts beat BTC and rights, supply and execution still matter.
How has BNB performed over 7, 30, 90 and 365 days?
The matched Binance spot daily-open returns are 7 days +5.2%; 30 days +11.8%; 90 days +36.8%; 365 days −23.7% through September 25, 2026. These are dated historical windows, not live quotes.
Is BNB burn the same as a dividend?
No. Burning reduces supply; it does not distribute cash or company revenue to each holder.
Does BNB have only 100 million coins now?
No. The 100 million figure is a burn target described by BNB Chain, not the frozen current circulating amount.
Does holding BNB mean owning Binance?
No. BNB is a crypto asset, not corporate stock.
Can I reproduce this BNB study?
Yes. The page exposes every 57 matched 90-day start, the daily input CSV, exclusions, version and hashes. The windows overlap, so observed counts are not independent future probabilities.
Does BNB trading volume guarantee easy execution?
No. The 30-day Binance spot turnover is separate from one sampled order book. At the cited snapshot the returned ±1% book depth was $6,336,529; later depth and actual fills can differ.
Can a Binance fee discount make BNB a risk-free holding?
No. Confirm your current account/product eligibility, calculate the fees you could actually save and compare with BNB price and exit costs. The frozen spot study does not include discount benefits.
What are BNB tokenomics?
BNB supply falls through completed Auto-Burn and activity-linked BEP-95 burns. The 200-million historical maximum and 100-million burn target are not current circulating supply. Burning is not a passive-holder dividend.
Sources and verification
- CoinNudge frozen spot-path researchMatched daily-open returns, full cohort and audit hashes.
- Complete monthly observation ledgerEvery eligible 90-day matched start.
- Daily historical input ledgerActual daily inputs with observation and ingestion time.
- Matched BTC daily input ledgerThe same-date BTC opens used in every paired return and drawdown.
- Frozen CoinGecko supply responseProvider-defined current float, total and maximum supply at its own timestamp.
- Dated order-book sourceSampled Binance books for covered markets; not the entire exchange.
- Social directory and limitationsDirectional 7-day X and 30-day Reddit mention counts; bot and promotion filtering unverified.
- BNB Chain token overviewSupply and use framework.
- BNB Chain BEP-95Gas-fee burn mechanism and governance parameter.
- BNB Smart Chain staking and reward recipientsNetwork delegation economics; not a passive-wallet dividend.
Monitor BNB market changes without treating a dated report as a current order.
Use this report for the thesis and risk checks, then verify current liquidity and any alert separately.
Preview Telegram alert coverage