Single-coin evidence report · By CoinNudge Research · · Guide updated 2026-10-03 · 20 min read
What is Edel (EDEL) coin, and is it worth holding?
Edel EDEL coin is separate from Edel’s tokenized-stock products; buying EDEL does not itself buy the underlying shares. A holding case needs verified product activity and an actual EDEL value-capture mechanism, not assumed stock backing or future buybacks. The frozen 90-day path ending September 26, 2026 gained +148.6% versus BTC +40.1%, yet only 2/6 historical 90-day month-start paths beat BTC and all had deeper daily-open drawdowns. Six overlapping paths are exploratory, not future buying odds.
See the research evidence · Check market context
Quick answer: EDEL coin in three checks
- Edel EDEL coin is separate from Edel’s tokenized-stock products; buying EDEL does not itself buy the underlying shares. A holding case needs verified product activity and an actual EDEL value-capture mechanism, not assumed stock backing or future buybacks. The frozen 90-day path ending September 26, 2026 gained +148.6% versus BTC +40.1%, yet only 2/6 historical 90-day month-start paths beat BTC and all had deeper daily-open drawdowns. Six overlapping paths are exploratory, not future buying odds.
- Coverage is 286 daily asset opens, with 6 complete historical 90-day month-starts. The cohort is exploratory.
- The unresolved value-capture question is: Do live tokenized-stock and lending products create observable EDEL demand or buybacks?
What is Edel EDEL coin, and how does it differ from Edel Stocks?
Edel develops infrastructure for tokenized equities and related market products. The product’s reserve-backed stock tokens and the separately traded EDEL token are different assets; buying EDEL does not buy underlying shares or obtain legally enforceable governance rights. The question for a prospective holder is: Do live tokenized-stock and lending products create observable EDEL demand or buybacks? This report separates issuer rules, third-party supply estimates and 286 observed spot daily opens rather than treating a price chart as proof of product adoption.
The issuer documentation supports the project description, but tokenholders, users, operators and treasury beneficiaries can be different parties. The table distinguishes what can be checked at this release from what would still need operating evidence. Use the rights and supply sections to define the holding thesis, then the BTC-matched paths to assess opportunity cost; neither layer substitutes for the other.
| EDEL research question | Current evidence | Boundary |
|---|---|---|
| What is the asset? | Edel develops infrastructure for tokenized equities and related market products. The product’s reserve-backed stock tokens and the separately traded EDEL token are different assets; buying EDEL does not buy underlying shares or obtain legally enforceable governance rights. | Issuer description, not holder income |
| Price evidence | 286 daily opens; 2025-12-15–2026-09-26 | Retrospective spot data |
| 90-day comparison | +148.6% versus BTC +40.1% | One ending-date path |
| Verified project-to-token cash flow | Not independently established | No dividend inferred |
Verify: Edel official docs · Edel official token disclosure · Edel official app/product overview
Does owning EDEL mean owning Edel Stocks or lending profits?
No: owning EDEL is not ownership of Edel Stocks or a contractual share of lending profits. The official documents describe Canton-native stock products and their separate backing model. The token disclosure reviewed in the frozen release grants no enforceable ownership, governance or profit-participation claim; a possible future program or buyback is not current yield.
A concrete token-capture analysis would track issued stock units and reserve attestations, actual lending balances and losses, realized product fees, then any on-chain EDEL purchase/burn or enforceable holder distribution. Merely adding tokenized-equity volume to the EDEL market cap would mix different claimants.
The participant categories below are analytical comparisons, not proof that EDEL grants current governance, mining income or a contractual product-profit share.
| Participant | Relevant right or activity | Do not infer |
|---|---|---|
| Product user | Edel documents tokenized-equity infrastructure and planned lending/market products. Product-level backing of Edel Stocks does not mean EDEL tokenholders own the underlying securities. | Every user must hold the token |
| Passive token holder | The issuer token disclosure does not grant an enforceable ownership or profit claim. Planned governance or buybacks are not executed yield. | Equity or automatic fee income |
| Operator, miner or DAO participant | Depends on this project’s participation rules | Same economics as simply buying the spot token |
Verify: Edel official docs · Edel official token disclosure · Edel official app/product overview
How should EDEL’s one-billion token supply be read?
The issuer token disclosure describes one billion EDEL maximum units, and the frozen provider snapshot estimates circulating units. The difference is not an unlock calendar; treasury wallets, vesting contracts and dated transfers are needed to identify when additional supply could reach a venue.
EDEL’s small-cap price can move sharply on relatively modest flows. Fully diluted value is a scenario valuation of the token stock, not the notional backing of Edel Stocks, not loan collateral and not guaranteed future revenue.
CoinGecko’s 2026-09-27T03:57:30.000Z snapshot estimates 678,451,925 circulating EDEL, 1,000,000,000 total and 1,000,000,000 maximum units. These are provider estimates, not a verified holder ledger. In particular, the gap between total and circulating units is not a dated unlock schedule.
| EDEL supply field | Frozen estimate or official rule | Correct reading |
|---|---|---|
| Official distribution | Issuer disclosure describes one billion EDEL maximum units; current circulating amount is a provider estimate. A stock difference is not an unlock timetable. | Issuer mechanism; check actual transfers |
| Circulating | 678,451,925 | Provider estimate, not spendable-float audit |
| Total / maximum | 1,000,000,000 / 1,000,000,000 | Neither is a forecast of tomorrow’s sell pressure |
| Market cap / FDV | $19,264,134 / $28,394,251 | Valuation measures, not realized project revenue |
Verify: Frozen provider supply response · Edel official docs · Edel official token disclosure · Edel official app/product overview
Which Edel issuance, lending and buyback figures are still missing?
Live stock issuance, recurring lending results and executed EDEL buybacks were not independently verified as a continuous series in this frozen release. The report therefore does not establish product revenue reaching EDEL holders. The explicit null operating_observation and token_capture_observation mean not verified, never zero activity.
For a follow-up release, request 1) Live tokenized-equity issued stock with source-labelled reserve checks; 2) Completed loan balances, interest income and defaults by week; 3) Dated EDEL buybacks executed on-chain and circulating-supply reconciliation. Align their observation dates to supply and prices before testing whether use and token demand move together.
Tokenized-equity themes attract both actual market-structure users and speculative token buyers. Evaluate legal redemption and reserve conditions for Edel Stocks separately from the EDEL token; social excitement about stocks moving on-chain does not identify EDEL demand or a tokenholder claim.
| Evidence test | What this release has | What it can and cannot show |
|---|---|---|
| Edel Stocks backing model | Official product documentation exists | Does not itself establish EDEL holder claim |
| Completed lending and fee revenue | No independently frozen recurring series | Would test economic product use and credit risk |
| EDEL buybacks or fee capture | No dated executed series verified here | Planned programs must not be booked as realized yield |
Verify: Source-status record · Edel official docs · Edel official token disclosure · Edel official app/product overview
Did EDEL’s 90-day surge beat BTC—and was it typical?
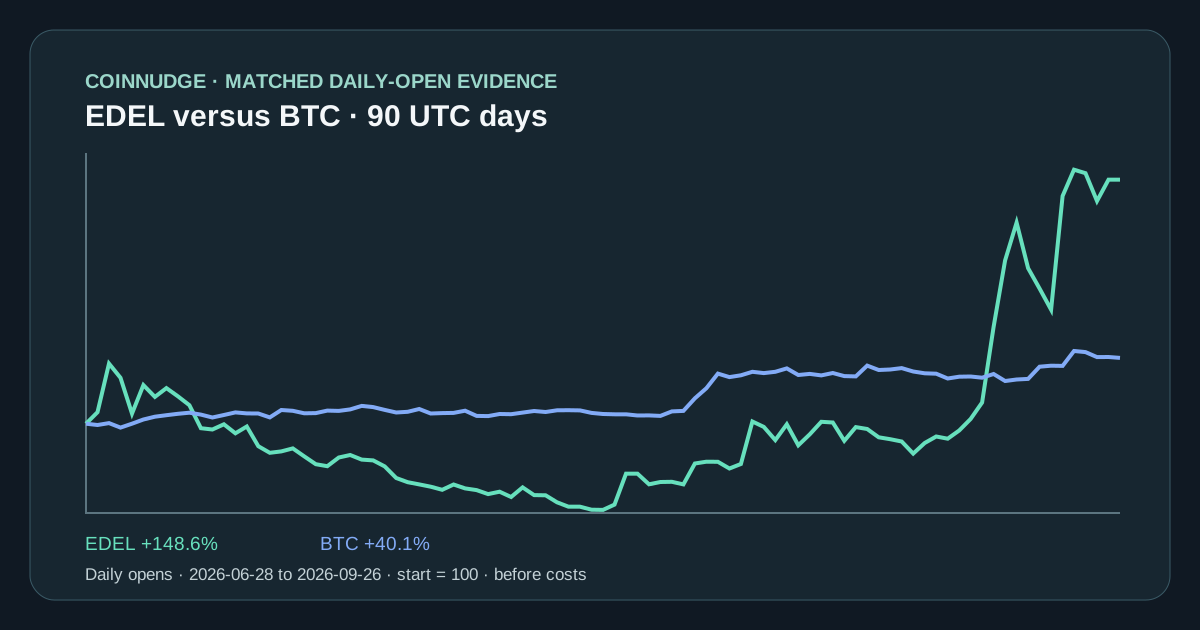
EDEL’s frozen 90-day path ending September 26, 2026 beat BTC: +148.6% versus +40.1%. It was not typical of the six historical month-start paths, whose median EDEL return was −14.8%; the recent path itself had a −65.2% daily-open drawdown. A surge and a severe loss along the way can coexist. The matched windows below show how much the answer changes with entry horizon, while the chart compares normalized values from the same UTC start. EDEL/USDT comes from a retrospective MEXC public API retrieval while BTC/USDT comes from CoinNudge’s local Binance archive; cross-venue basis and stablecoin pair differences are not adjusted.
A spot return excludes fees, spread, slippage, taxes and any financing cost. Drawdown uses daily opens and therefore can miss worse intraday prices. A price increase cannot independently establish that token economics improved.
| Matched UTC holding window | EDEL return | BTC return | EDEL − BTC | Path drawdown |
|---|---|---|---|---|
| 7 days · 2026-09-19–2026-09-26 | +36.4% | +4.0% | +32.4 pp | −7.5% |
| 14 days · 2026-09-12–2026-09-26 | +159.3% | +8.9% | +150.4 pp | −23.8% |
| 30 days · 2026-08-27–2026-09-26 | +176.0% | +6.4% | +169.6 pp | −23.8% |
| 60 days · 2026-07-28–2026-09-26 | +303.3% | +31.9% | +271.4 pp | −24.5% |
| 90 days · 2026-06-28–2026-09-26 | +148.6% | +40.1% | +108.5 pp | −65.2% |
| 180 days · 2026-03-30–2026-09-26 | +236.5% | +27.4% | +209.1 pp | −68.2% |
| 365 days · 2025-09-26–2026-09-26 | Unavailable | Unavailable | — | 80 missing daily bars |
Verify: All asset daily inputs
Was EDEL’s sharp 90-day rally typical across its six historical starts?
The main hypothesis was that EDEL would beat BTC over prespecified 90-day month-start holding periods. The observed main result was 2/6 BTC-beating paths, median EDEL return −14.8% versus median BTC −6.2%, and 6/6 with a deeper asset drawdown. A BTC-beating count is not a buy probability, because starts overlap and the studied coin was selected as a currently interesting asset.
The sample is one symbol, not all available coins: 286 EDEL daily opens from 2025-12-15 to 2026-09-26. We predeclared first-of-month 30/90-day and Monday 14-day entry dates, require complete same-UTC asset and BTC paths, and keep excluded candidates in a separate ledger. EDEL/USDT comes from a retrospective MEXC public API retrieval while BTC/USDT comes from CoinNudge’s local Binance archive; cross-venue basis and stablecoin pair differences are not adjusted.
Only 6 complete 90-day starts meet the protocol; no confidence interval or general future win probability is claimed. The non-overlapping sensitivity contains 2 starts.
| Prespecified holding sample | Complete / candidate | EDEL median | Beat BTC | Deeper drawdown | Status |
|---|---|---|---|---|---|
| Monthly 90 days | 6/6 | −14.8% | 2/6 | 6/6 | Exploratory |
| Monthly 30 days | 8/8 | −3.7% | 4/8 | 8/8 | Exploratory |
| Monday 14 days | 39/39 | −7.4% | 18/39 | 39/39 | Descriptive; overlapping |
Verify: Full research JSON · All candidate outcomes
What happened to EDEL after stronger or weaker BTC months?
EDEL’s three starts after prior BTC strength had a +12.5% median 90-day return and two BTC-beating paths; the three after prior weakness had a −22.1% median and none. This difference describes six historical paths, not a validated entry rule or a reliable response to the next BTC trend. BTC state means its 30-day return before entry, not whether BTC fell during the later holding window; this is not a simultaneous sell-off hedge test.
Before each hypothetical entry, BTC’s preceding 30-day daily-open return classifies the market as up or down. The classification uses only information available before that entry, not the later BTC outcome. The table tests whether EDEL’s relationship with BTC is stable across prior environments.
Even a large subgroup is only descriptive: there is one asset, one exchange pair and correlated market periods. If a subgroup is below 20 observations, treat its ratio as exploratory. We do not present a small split as evidence of a predictive trading signal.
| Pre-entry BTC state | 90-day starts | EDEL median | Beat BTC |
|---|---|---|---|
| Prior BTC 30d up | 3 | +12.5% | 2/3 |
| Prior BTC 30d down | 3 | −22.1% | 0/3 |
| Prior BTC state unavailable | 0 | — | 0/0 |
Verify: Full observation ledger
What did EDEL’s winning and losing paths cost holders along the way?
A profitable EDEL endpoint did not spare a holder from deep losses: the April 2026 winning path below still had a −42.4% daily-open drawdown. The weakest BTC-relative 90-day start was 2026-02-01: EDEL −44.1% versus BTC −0.6%, with −64.7% daily-open path drawdown. The strongest counterexample was 2026-04-01: EDEL +74.0% versus BTC −11.8%. These were selected after calculation to illustrate both tails, never to define a trading rule.
The table shows 6 most recent eligible 90-day starts out of 6; 0 older starts remain in the public CSV. Dates are UTC, endpoints use opening prices, and the drawdown column describes the loss a holder might have seen before the endpoint. A positive final return could still have been difficult to hold through.
The current 90-day result and the historical cohort answer different questions. A short rally may be real while the base rate of earlier starts is weak. The risk check is to ask what would invalidate the issuer’s token mechanism and whether the present price can be executed at the intended size.
| UTC start | UTC end | EDEL return | BTC return | EDEL − BTC | Path drawdown |
|---|---|---|---|---|---|
| 2026-01-01 | 2026-04-01 | −38.5% | −22.1% | −16.4 pp | −83.1% |
| 2026-02-01 | 2026-05-02 | −44.1% | −0.6% | −43.5 pp | −64.7% |
| 2026-03-01 | 2026-05-30 | −7.5% | +9.7% | −17.2 pp | −69.8% |
| 2026-04-01 | 2026-06-30 | +74.0% | −11.8% | +85.8 pp | −42.4% |
| 2026-05-01 | 2026-07-30 | +12.5% | −16.2% | +28.7 pp | −60.1% |
| 2026-06-01 | 2026-08-30 | −22.1% | +6.2% | −28.2 pp | −66.5% |
Verify: All case rows
Why can EDEL turnover exaggerate executable liquidity?
Across 30 valid recent daily candles, median quoted daily EDEL turnover on MEXC Spot EDELUSDT was $171,007. This is traded amount accumulated over 24 hours, not bid-side depth at one instant. The higher the intended order relative to live depth, the less a historical daily-open return describes attainable performance.
No synchronized live spread or level-two depth is frozen for this release, so this report cannot quote a trustworthy $10,000 execution cost. Check a fresh order book, pair identity, fees and withdrawal route before interpreting the historical numbers as personally tradable.
For a proposed EDEL order, compare its size with same-time asks for an entry and bids for an exit, calculate size-weighted prices plus your actual fees, and check the permitted withdrawal network. If depth is absent or the estimated exit loss exceeds your budget, reduce the size or wait; the historical turnover figure cannot pass that test for you.
| Execution input | Observed or missing | Action |
|---|---|---|
| 30-day median daily quote turnover | $171,007 | Context only; not executable depth |
| Spot venue | MEXC Spot EDELUSDT | Check your actual trading venue |
| Live spread and ±1% depth | Not captured in release | Obtain a current order-book snapshot |
| Leverage, funding and liquidation | Not modelled | Do not apply spot outcomes to perps |
Verify: Venue candle inputs
What evidence would justify holding EDEL after a rapid rally?
EDEL needs product-to-token evidence before a recent rally becomes a long-term holding case: reconcile live issuance and reserves for the stock products, completed lending outcomes where applicable, and executed EDEL buybacks or another documented capture route. Product backing must not be attributed to EDEL merely because the names are related.
First separate the EDEL contract and its holder rights from the stock products and their redemption rights. If issuance, loan outcomes or buyback execution are only planned, retain that status and wait for dated evidence instead of valuing them as current tokenholder income. Use a fresh executable quote and your own horizon and loss limit; none of the historical start frequencies is a future win probability.
| Decision gate | Evidence to request | Failure mode |
|---|---|---|
| Project activity | Live tokenized-equity issued stock with source-labelled reserve checks | Project story remains unmeasured |
| Token capture | Dated EDEL buybacks executed on-chain and circulating-supply reconciliation | Usage never reaches passive holder |
| Opportunity cost | 6 90-day starts versus BTC | One recent rally replaces full distribution |
| Supply | Issuer disclosure describes one billion EDEL maximum units; current circulating amount is a provider estimate. A stock difference is not an unlock timetable. | Actual transfers or emissions overwhelm demand |
| Execution | Fresh spread and order-book depth | Historical price cannot be filled |
Verify: EDEL frozen token-economics evidence · EDEL BTC-matched holding paths
How can the EDEL analysis be reproduced?
Reproduce the EDEL price results from the public daily-input and observation files: verify the release manifest hashes, join asset and BTC opens on UTC dates, require a complete path, then recalculate returns and running-peak drawdown. A hash mismatch or a missing date means stop and resolve the input mismatch, not fill it with zero.
Calculation version single-coin-paired-paths-20260927-2.0; price endpoint 2026-09-26 UTC; asset coverage 2025-12-15–2026-09-26; source type retrospective public MEXC API retrieval. Price returns are end daily open divided by start daily open minus one. BTC-relative results are percentage-point differences, and path drawdown is the worst normalized daily open versus the earlier running peak.
All dates, qualified observations, excluded candidate starts and exact inputs are available below. EDEL/USDT comes from a retrospective MEXC public API retrieval while BTC/USDT comes from CoinNudge’s local Binance archive; cross-venue basis and stablecoin pair differences are not adjusted. Historical backfills are not labelled as data originally observed by CoinNudge at those old event dates. The provider supply snapshot was retrieved on 2026-09-27T03:59:28.770Z; it is not a 2023 or 2025 point-in-time supply estimate.
The release manifest hashes frozen inputs and outputs. Operating-source review is a separate version with nulls for unverified activity and token capture. No p-value or out-of-sample trading edge is asserted; sample selection, overlapping windows, venue differences and survival of the selected token limit inference.
Editorial review: October 3, 2026. Definitions, result explanations and holding conditions were clarified; no historical experiment was rerun. Price evidence still ends September 26, 2026, and the separate supply/source review remains dated September 27. Recheck current issuer terms, transfers and order-book liquidity before using this historical report for a present decision.
| Public evidence file | Purpose | Availability |
|---|---|---|
| Research JSON | /research-data/hot-coin-profiles/2026-09-27-v2/edel.json | All summary and row-level results |
| Outcome CSV | /research-data/hot-coin-profiles/2026-09-27-v2/edel-observations.csv | Every qualifying historical start |
| Exclusion CSV | /research-data/hot-coin-profiles/2026-09-27-v2/edel-exclusions.csv | Missing or rejected candidates |
| Asset candle CSV | /research-data/hot-coin-profiles/2026-09-27-v2/edel-daily-inputs.csv | Unrounded price/turnover inputs |
| BTC candle CSV | /research-data/hot-coin-profiles/2026-09-27-v2/btc-daily-inputs.csv | Same-date comparator |
| Field dictionary | /research-data/hot-coin-profiles/2026-09-27-v2/field-dictionary.json | Formula and null semantics |
| Fundamental review | /research-data/coin-fundamentals/2026-09-27-v3/edel.json | Issuer rules and explicit evidence gaps |
| Manifest | /research-data/hot-coin-profiles/2026-09-27-v2/manifest.json | Frozen SHA-256 identities |
Verify: Frozen paired-price study · Full cohort observations · Asset daily spot inputs · Same-date BTC inputs · Excluded candidate ledger · Calculation dictionary · Frozen input manifest · Tokenomics and fundamental source review · Frozen CoinGecko supply snapshot · MEXC original kline response · MEXC official spot kline specification · Edel official docs · Edel official token disclosure · Edel official app/product overview
Take the next step with this evidence.
Choose ongoing Telegram monitoring or inspect structured data in your own research workflow.
Receive qualifying events in Telegram.
Use the ready-made alert checklist, message explanations and daily briefing. Check the supported categories and coins before subscribing; every Research page is not a separate alert category.
Check the alert list · View alert plans
Inspect the data before choosing a pack.
Prepared research packs supply scoped features, separate outcomes where available and quality flags. Buy a fixed edition once and download directly; API use is optional.
Check data pack samples · Explore the full data catalog · Compare data plans
Each purchased pack includes its specified fields and published date range. This page's full dataset is not automatically included. Other data families require coverage, date, field and source-use confirmation before purchase. Telegram Pro is a separate 30-day service; historical packs are one-time purchases.
Frequently asked questions
What is EDEL coin and what is it used for?
Edel develops infrastructure for tokenized equities and related market products. The product’s reserve-backed stock tokens and the separately traded EDEL token are different assets; buying EDEL does not buy underlying shares or obtain legally enforceable governance rights. That mechanism does not guarantee an investment return.
Is EDEL coin worth buying or holding?
EDEL needs product-to-token evidence before a recent rally becomes a long-term holding case: reconcile live issuance and reserves for the stock products, completed lending outcomes where applicable, and executed EDEL buybacks or another documented capture route. Product backing must not be attributed to EDEL merely because the names are related. The short historical cohort is exploratory; price evidence ends September 26, 2026, and current supply and executable liquidity must be checked separately.
How has EDEL performed compared with Bitcoin?
In the 90-day same-UTC period ending September 26 2026, EDEL returned +148.6% and BTC returned +40.1%. Across 6 eligible historical 90-day month-starts, 2 beat BTC.
How many historical EDEL observations are in this study?
286 daily asset opens and 53 accepted holding-path rows across three horizons. Historical retrieval is retrospective, not original-date local observation.
Does EDEL give me ownership of tokenized stocks?
No. Edel Stocks and the EDEL token have different rights; the issuer does not grant EDEL holders underlying equity ownership.
Are EDEL buybacks a guaranteed yield?
No. Treat planned or discretionary buybacks as unverified until dated execution and token amounts are public.
Does the latest EDEL 90-day surge prove it is worth holding?
No. Only two of six complete historical 90-day monthly starts beat BTC; the sample is exploratory and later outcomes are unknown.
Can I download and reproduce the EDEL result?
Yes. The complete JSON, observation CSV, daily inputs, exclusion ledger, field dictionary and SHA-256 release manifest are linked in the method section.
Sources and verification
- Frozen paired-price studyAll calculations, observations, hashes and inclusion counts
- Full cohort observationsEvery eligible 14/30/90-day start
- Asset daily spot inputsAll daily opens and quoted turnover
- Same-date BTC inputsBTC/USDT benchmark
- Excluded candidate ledgerMissing paired paths, if any
- Calculation dictionaryReturn and drawdown formulas
- Frozen input manifestSHA-256 for release files
- Tokenomics and fundamental source reviewIssuer claims and explicitly missing operating evidence
- Frozen CoinGecko supply snapshotProvider estimate and retrieval time
- MEXC original kline responseRetrospective exchange response with request URLs
- MEXC official spot kline specificationAPI fields and timestamp rules
- Edel official docsOfficial issuer or protocol disclosure
- Edel official token disclosureOfficial issuer or protocol disclosure
- Edel official app/product overviewOfficial issuer or protocol disclosure
Track EDEL in the wider market context.
Use this report to frame the token-economics questions, then verify today’s liquidity and supply before acting.
Explore market alerts