Timeframe strategy comparison · By CoinNudge Research · · Guide updated 2026-10-03 · 12 min read
Bitcoin trading signals: 5m, 15m or 1h?
For this one fixed Bitcoin EMA9/EMA21 trading rule, moving from 5-minute to 15-minute to 1-hour completed candles reduced trade count and modeled costs, but none made money over the common year ending September 25, 2026. The 5m version placed 2,516 simulated trades and returned −18.99% net; 15m placed 819 and returned −6.72%; 1h placed 191 and returned −0.67%. All 105,120 expected 5m bars, 35,040 15m bars and 8,760 1h bars were present. This answers a narrow timeframe-and-cost question, not which timeframe or indicator will win next.
Test your BTC strategy · Inspect all 3,526 trades
What changed when the same BTC signal moved across timeframes?
- All three versions lost money after modeled costs in the same complete 365-day BTC sample: 5m −18.99%, 15m −6.72%, 1h −0.67%.
- The 5m preset generated 2,516 trades versus 191 on 1h and paid about $1,258 versus $96 in modeled commissions; increasing signal frequency did not create an edge here.
- Doubling both modeled fees and adverse slippage worsened 5m to −36.64%, 15m to −12.42% and 1h to −1.99%.
- EMA9/21 spans different clock time on each chart. This is a comparison of three practical presets, not a causal proof that the 1h bar itself was responsible.
Are 5-minute, 15-minute or 1-hour Bitcoin trading signals more reliable?
In the tested EMA9/21 example, the 1h preset lost the least and had the smallest sampled account drawdown. That does not make it a universally reliable signal. The 5m version acted about 13 times as often as the 1h version, spent more on fees and remained exposed more of the observed bars. The account size and $500 trade margin were held fixed, but signal timing and the effective trend horizon changed together.
The three samples have identical UTC start and end points and zero missing bars in their requested year. BTC was the only asset; the market year included both rising and falling regimes but is not a multi-cycle test. The numbers below are outcomes of simulated orders on completed Binance spot candles with next-open paper fills.
| BTC EMA signal interval | Closed candles present | Completed trades | Net account return | Sampled max drawdown | Modeled commissions |
|---|---|---|---|---|---|
| 5m | 105,120 / 105,120 | 2,516 | −18.99% | 18.99% | $1,257.68 |
| 15m | 35,040 / 35,040 | 819 | −6.72% | 7.37% | $409.37 |
| 1h | 8,760 / 8,760 | 191 | −0.67% | 2.23% | $95.51 |
Did the shorter BTC chart create more profit—or just more trades?
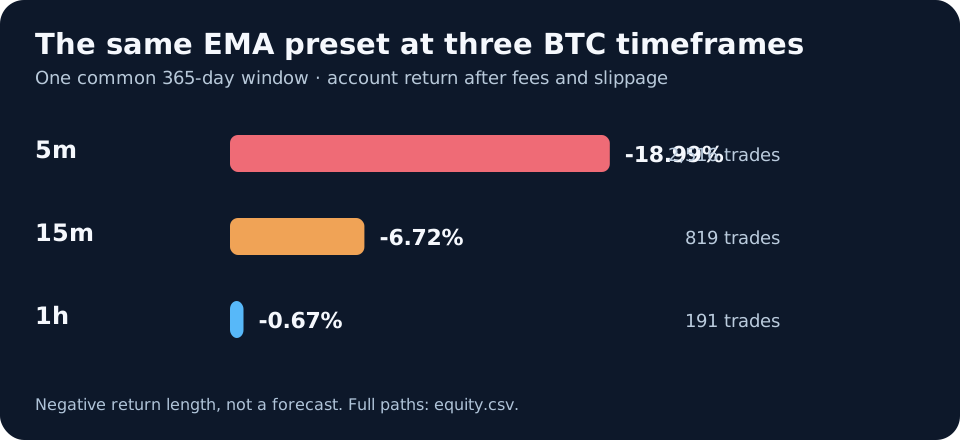
No. The 5m policy had 2,516 completed trades and 480 profitable trades, but its net account result was −18.99%. The 15m policy had 819 trades with 187 winners and lost 6.72%; 1h had 191 trades with 56 winners and lost 0.67%. Win counts are not risk-adjusted performance measures: most trades under each rule were net losers, and the amounts of wins and losses matter.
The chart intentionally shows account returns rather than raw BTC returns. The fully invested BTC buy-and-hold reference was about −24.76% in this particular year, but comparing it directly with a strategy that committed at most $500 of a $10,000 account per entry would exaggerate the signal's apparent benefit from simply holding cash.
Verify: Fixed EMA9/21 account outcomes and exposure assumptions · All 3,526 simulated trades
What exact 5m, 15m and 1h signal rules did we test?
On each interval, EMA9 crossing above EMA21 on a completed bar proposes one long entry at the next bar's open. An opposite cross closes at the next open. A 2% stop, 4% target and 48-hour maximum hold also close a position. At most one position is open, with $500 nominal margin, 1× exposure, a $10,000 starting account, 0.05% fee and 0.02% adverse slippage on each fill. A stop and target both touched within one OHLC bar are resolved stop-first.
These settings were frozen before running the three-way comparison. The EMA periods count bars, not minutes: EMA21 sees about 105 minutes on 5m, 315 minutes on 15m and 21 hours on 1h. Therefore the experiment changes both review frequency and calendar-time trend definition. The rule is deliberately simple and is not a selected best strategy.
| Preset | EMA9 clock span | EMA21 clock span | Next signal review |
|---|---|---|---|
| BTC 5m | 45 minutes | 105 minutes | After each completed 5m bar |
| BTC 15m | 135 minutes | 315 minutes | After each completed 15m bar |
| BTC 1h | 9 hours | 21 hours | After each completed 1h bar |
Verify: Frozen research protocol
Does EMA21 mean the same trend on a 5m, 15m and 1h Bitcoin chart?
No. The period counts bars: 21 × 5m is 105 minutes, 21 × 15m is 315 minutes and 21 × 1h is 21 hours. These spans describe the nominal period, not a hard cutoff: an exponential moving average retains decaying weight from earlier bars. The frozen test therefore changes the effective trend horizon as well as the decision frequency.
To ask only whether more frequent execution helps, a new protocol would have to define comparable clock-time trend features, decision timing, exposure and costs before analysis. To ask whether each native preset works, retain EMA9/21 at each interval but acknowledge that these are different strategies. Those two questions are not interchangeable.
This edition answers the second question on one shared BTC year. It does not contain a new matched-horizon experiment, an optimized EMA choice or a universal ranking of 5m versus 1h data. The least-negative 1h row is evidence about that preset, not about all hourly signals.
Verify: Frozen signal definitions, warmup and fill protocol · Public three-preset outcomes
How much do fees and slippage change short-timeframe BTC signals?
In the base assumptions, 5m commissions totaled $1,257.68, 15m $409.37 and 1h $95.51. Adverse slippage is embedded in entry and exit fill prices rather than added to that commission number. Under a prespecified sensitivity that doubles both fee and slippage rates, returns became −36.64%, −12.42% and −1.99%, respectively. The 5m rule is most exposed to repeated round-trip friction because it trades far more often.
Real traders may pay different fees and suffer different slippage. The result does not justify simply switching to hourly charts; it shows that a candidate short-term strategy needs enough expected edge to survive its actual order frequency and execution costs.
| BTC chart interval | Base net return | Double-cost net return | Change in percentage points |
|---|---|---|---|
| 5m | −18.99% | −36.64% | −17.65 pp |
| 15m | −6.72% | −12.42% | −5.69 pp |
| 1h | −0.67% | −1.99% | −1.32 pp |
Verify: All cost scenarios · Calculate your own trading break-even costs
Was the 5m Bitcoin loss confined to one part of the tested year?
No single half explains the whole loss: the first 5m half recorded 1,260 trades and −$989.17 aggregate trade P&L; the second had 1,256 trades and −$909.76. The 15m halves were also both negative (−$297.17 and −$375.00). For 1h, the first half lost $108.19 while the second made $40.75, partly offsetting the year loss. Calendar-month group totals and the full trade ledger are downloadable so a reader can inspect concentration rather than trusting one headline.
These are overlapping observations from one BTC path, not independent experiments. The 1h result could change markedly in another year. Maximum sampled account drawdown was 18.99% at 5m, 7.37% at 15m and 2.23% at 1h, but the sampled equity series does not include every intrabar extreme. A stop hit during an outage or market gap could fill worse than the modeled bar value.
| Interval | First half trades / net trade P&L | Second half trades / net trade P&L | Counterexample or caution |
|---|---|---|---|
| 5m | 1,260 / −$989.17 | 1,256 / −$909.76 | Loss repeated in both halves |
| 15m | 398 / −$297.17 | 421 / −$375.00 | More selective than 5m, still lost |
| 1h | 96 / −$108.19 | 95 / +$40.75 | A profitable half did not make the whole year profitable |
Verify: Month-by-month grouped results · Sampled account paths
How should a trader choose a crypto signal timeframe after this test?
Begin with your actual holding period, ability to monitor, exchange costs and the market move needed to pay those costs. A 5m alert may be valuable for monitoring a fast event without being a profitable automatic entry. A 1h alert may reduce repeated noise but can arrive later relative to a short move. Confirm higher-timeframe context and liquidity before treating any RSI, MACD or EMA crossing as a buy or sell instruction.
Do not set a timeframe by selecting the least negative row of one retrospective table. Write the entry/exit rule and risk budget, test the same historical period after actual costs, then evaluate a later untouched forward window. If 5m, 15m and 1h disagree, the conflict itself tells you the proposed trade spans different horizons; it is not three independent votes.
Verify: Technical signal alert scope · BTC strategy testing workbench
What should you do when 5m, 15m and 1h Bitcoin signals disagree?
Interpret disagreement as different horizons observing the same path, not three independent voters. A short bounce can move a 5m indicator while a slower trend remains downward; neither reading alone supplies a profitable entry.
Write the trade's intended hold period first. Use the chosen decision interval consistently, identify whether a higher-timeframe condition is an entry filter or just context, and state what closes or invalidates the trade. Wait for the relevant bar to complete; do not compare a still-moving 5m candle with completed 1h evidence as if both were final.
If a new multi-timeframe filter is proposed, retain rejected signals, actual monitoring delay and costs, then compare the same opportunity set under a frozen protocol. This research replay tested one completed-bar EMA rule, not that filter, RSI confirmation or live model decisions. Its results justify examining friction and horizon mismatch—not choosing whichever timeframe is green now.
Verify: Authored EMA trade protocol · Technical alerts and their actual scope
Can you reproduce the BTC three-timeframe signal test?
Yes. The release provides 5m, derived 15m and 1h closed-candle CSV.gz files, 3,526 trade rows, sampled equity, monthly groups, the frozen protocol, SHA-256 manifest, result JSON and a standalone standard-library replay. The independent program reconstructs EMA crossings, next-open entries, opposite-cross exits, stop-first OHLC exits, costs and ordinary/double-cost final balances without importing the production replay function.
All timeframes use the same 365-day main period ending 2026-09-25 06:00 UTC, and all requested bars were present. The 15m bars require three contiguous archived 5m inputs; historical archive retrieval is retrospective, not proof that CoinNudge saw each candle live at that time. No funding, order-book queue, real exchange fill or AI-per-bar model choice is inserted into this calculation. The independent replay checks simulated rules, not whether real customers could execute the prices.
| Published artifact | What to inspect |
|---|---|
| research.json | Period, coverage, results and calculation version |
| trades.csv / equity.csv / monthly.csv | Every completed paper trade, account path and month group |
| btc-5m/15m/1h-candles.csv.gz | Exact historical closed-bar inputs |
| reproduce.py / manifest.json | Independent numerical checks and immutable file hashes |
Verify: Full frozen result · Independent trade replay
Take the next step with this evidence.
Choose ongoing Telegram monitoring or inspect structured data in your own research workflow.
Receive qualifying events in Telegram.
Use the ready-made alert checklist, message explanations and daily briefing. Check the supported categories and coins before subscribing; every Research page is not a separate alert category.
Check the alert list · View alert plans
Inspect the data before choosing a pack.
Prepared research packs supply scoped features, separate outcomes where available and quality flags. Buy a fixed edition once and download directly; API use is optional.
Check data pack samples · Explore the full data catalog · Compare data plans
Each purchased pack includes its specified fields and published date range. This page's full dataset is not automatically included. Other data families require coverage, date, field and source-use confirmation before purchase. Telegram Pro is a separate 30-day service; historical packs are one-time purchases.
Frequently asked questions
Are 5-minute Bitcoin signals better than 1-hour signals?
Not in this fixed EMA9/21 example. Over one complete BTC year, 5m returned −18.99% net after 2,516 simulated trades, while 1h returned −0.67% after 191. That does not establish a universal 1h advantage or test every indicator.
Why did the 5m rule lose more?
It traded much more often and paid more modeled fees and slippage; it also tested a much shorter calendar-time EMA trend. The study cannot isolate which difference caused its relative loss.
Did the study include Binance BTC spot fees?
It modeled 0.05% fee and 0.02% adverse slippage per fill, with a double-cost sensitivity. Those are explicit assumptions, not your personal fee tier or verified live fills.
Do 15m and 1h RSI alerts count as independent confirmations?
No. Different timeframes can provide useful context, but readings on the same BTC price path are dependent. This experiment tested EMA crosses, not an RSI confirmation strategy.
Can I test my own 5m, 15m or 1h rule?
CoinNudge's registered-user BTC strategy workbench supports bounded rule families on those intervals. Review the interpreted rule and actual coverage before running a historical simulation.
Is this AI autonomously trading one year of Bitcoin?
No. It is a deterministic replay of an authored EMA rule. CoinNudge's forward AI paper accounts are separate and much shorter-lived.
Sources and verification
- CoinNudge frozen three-timeframe resultBTC 5m/15m/1h counts, returns, costs and coverage.
- CoinNudge independent trade replayClosed-bar EMA signal and fill arithmetic reproduced without production replay imports.
- Binance Spot K-line definitionsOfficial source field definitions; CoinNudge frozen archives were retrieved retrospectively.
Describe your own BTC rule and inspect the actual costs, trade count and data coverage at the interval you intend to use.
The user strategy test is historical code replay; the forward AI model accounts are a separate paper demonstration.
Open BTC strategy test