Point-in-time cost scenario · By CoinNudge Research · · Guide updated 2026-10-03 · 12 min read
Crypto Trading Fees: How Much Must Price Move to Break Even?
Crypto trading break-even is the exit at which proceeds cover entry, exit and instrument-specific costs—not merely a green price move. In the frozen September 25 Binance spot-book example, a $1,000 round trip with 0.10% fees per side required about a 0.200% midpoint rise for BTC but 0.462% for the thinner SAGA book. For linear futures, use executed notional, signed funding and long/short fills; margin ROI is not whole-account profit. This page separates your calculator assumptions from the dated book evidence and does not estimate a guaranteed executable exit.
Explore market liquidity · Preview Telegram alerts · Inspect cost evidence
What determines a crypto trade's break-even price?
- Both entry and exit fees count. A modeled 0.10% on each side already demands slightly more than a 0.20% price rise even if the book spread were nearly zero.
- Bid–ask spread and depth can make a larger order more expensive. In the observed SAGA book, a $10,000 order needed a modeled 0.989% midpoint rise versus 0.278% for $100.
- The live calculator is a scenario tool, not an exchange fee quote. It does not guarantee a limit-order fill, a future order book or realized profit.
- All six 1,000-level snapshots, 36 calculations, a CSV and an independent replay script are public, so the arithmetic can be checked.
Which crypto break-even formula should I use: spot, long or short futures?
Choose the instrument and fee convention before entering numbers. Unborrowed spot tracks money spent acquiring coins and proceeds from selling them. A linear USDT long or short tracks quantity, entry/exit fill differences, fees on each traded notional and signed accumulated funding. These accounting paths are not interchangeable.
The retained spot study sweeps one captured ask book and then the bid book, with fees represented as USDT-equivalent costs. The interactive spot estimate uses your spread/impact assumptions instead; the contract calculator uses adverse fills and executed notional. Therefore copying the study’s spot threshold into a futures trade, or counting fill slippage again as a separate deduction, can misstate net profit.
If you hold an inverse coin-margined contract, option, borrowed spot short or portfolio on cross margin, these tools do not reconstruct that payoff or liquidation engine. Use the venue’s instrument-specific cash-flow rules. If you cannot identify the contract, fee asset or funding convention, record the missing input and do not treat an output as verified.
Verify: Frozen spot-book calculation protocol · Research on leverage survival and liquidation
How do you calculate long or short crypto profit after margin, leverage and fees?
For a linear USDT contract, start with executed opening notional N=margin M×leverage L and quantity q=N/entry fill; net profit then uses filled prices, each-side fees and signed funding. The same quantity has the same dollar price P&L at a different leverage, while margin ROI changes. Keeping margin fixed and raising leverage instead increases quantity and dollar risk. The calculator applies adverse entry slippage before sizing q, so executed opening notional remains N.
The calculator turns reference prices into adverse fills: a long buys at entry×(1+s) and sells at exit×(1−s); a short sells at entry×(1−s) and buys back at exit×(1+s). Gross P&L is q×(exit fill−entry fill) for a long and the opposite for a short. Fees are calculated once on each fill notional. Net P&L=gross−entry fee−exit fee−funding paid; negative funding paid represents a credit.
Three denominators answer different questions: net/M is return on opening margin; net/(M×L) is return on executed entry notional; net/account capital is the impact on your full account. Funding paid is an actual accumulated cash amount, not an unverified assumption that the current rate repeats. The calculator excludes liquidation and cannot validate whether the position could survive to the requested exit.
| Illustrative reference move | Margin / leverage / notional | Price P&L before costs | Return on margin | Return on $10,000 account |
|---|---|---|---|---|
| Long +1% | $500 / 10× / $5,000 | +$50 | +10% | +0.5% |
| Short −1% | $500 / 10× / $5,000 | +$50 | +10% | +0.5% |
| Long −1% | $500 / 10× / $5,000 | −$50 | −10% | −0.5% |
| Same quantity, double leverage | $250 / 20× / same $5,000 | Same $50 for the same move | +20% | Same +0.5% |
Verify: Official linear-contract P&L and leverage distinction
Why can a profitable-looking crypto position close at a loss?
An unrealized green number usually describes price P&L before at least some costs. With $5,000 reference notional, 0.05% entry and exit fees together are roughly $5 near an unchanged price. A $1 funding payment and adverse execution on both sides raise the amount to recover. A small favorable chart move can therefore end with negative realized cash.
Break-even solves net P&L=0 for the reference exit price using the same fill and fee assumptions as the displayed profit. It is not simply entry plus two fee percentages when exit notional changes or funding is nonzero. The short break-even lies on the downward side when net costs are positive. A large funding credit can put it on the other side; that is accounting, not a prediction.
Use actual account fee tiers and the correct instrument: this is not an inverse coin-margined contract, option premium, spot short with borrowing, or cross-margin liquidation engine. Blank fields and invalid directions cannot silently become zero-cost trades. Check mark-price liquidation, maintenance tier and maximum acceptable whole-account loss separately from the calculator.
| Input or number | Common misunderstanding | Correct interpretation |
|---|---|---|
| Leverage | A multiplier applied again to already leveraged dollar P&L | Leverage sets q through margin×leverage once |
| Margin ROI | The entire account earned this percentage | It uses only opening margin as denominator |
| Funding paid | Today’s rate is constant for the whole holding period | Enter signed cash from settlements or an explicitly hypothetical estimate |
| Slippage | Also subtract the same execution cost again | It is already applied in fill prices |
| Break-even price | An attainable exit or liquidation price | A conditional cost equality only |
How much must crypto rise to break even after buying and selling?
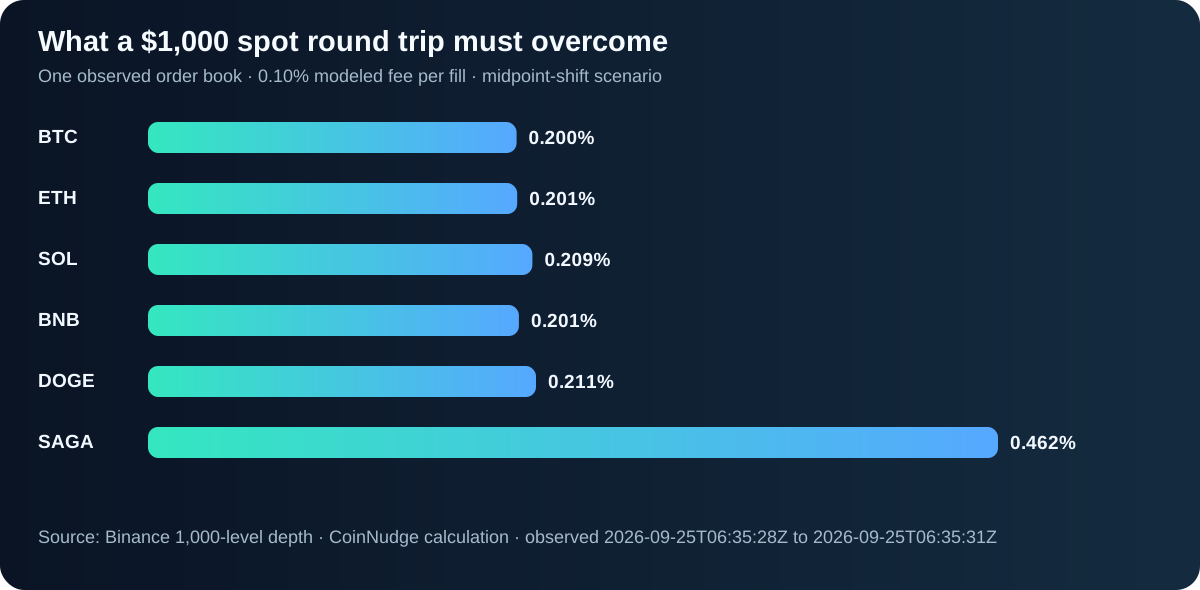
For a $1,000 hypothetical same-book round trip with 0.10% commission on each fill, the required uniform future midpoint rise was 0.200% for BTC, 0.201% for ETH, 0.209% for SOL, 0.201% for BNB, 0.211% for DOGE and 0.462% for the selected thinner SAGA book. One cannot call a 0.20% chart move a reliable profit: the fee alone nearly consumes it and book conditions differ by coin and order size.
The snapshot was collected sequentially between 06:35:28 and 06:35:31 UTC on September 25, 2026. It does not test what the books looked like yesterday, tomorrow or during volatility. Each pair's best bid, best ask and 1,000 depth levels are retained as input evidence, not summarized from a price chart.
The bar chart compares the six fixed $1,000 scenarios. It is an arithmetic comparison of point-in-time visible liquidity—not a ranking of which coin is worth buying.
| Binance USDT spot | Spread at observed book | $1,000 round-trip net if price unchanged | Modeled midpoint rise to break even |
|---|---|---|---|
| BTC | 0.001 bps | −2.00 USDT | 0.200% |
| ETH | 0.037 bps | −2.00 USDT | 0.201% |
| SOL | 0.860 bps | −2.09 USDT | 0.209% |
| BNB | 0.129 bps | −2.01 USDT | 0.201% |
| DOGE | 1.054 bps | −2.11 USDT | 0.211% |
| SAGA | 2.983 bps | −4.60 USDT | 0.462% |
Verify: All 36 observed calculations · Original depth snapshots
What is the exact trading break-even formula?
Start with the money actually spent, not the midpoint displayed in a chart. In this study, a marketable spot buy consumes the ask levels until it spends the chosen USDT amount N and obtains q coins. Selling q immediately into the retained bid levels produces gross proceeds S. With buy fee fB and sell fee fS, modeled net profit is S × (1 − fS) − N × (1 + fB). The USDT-equality point is zero. If the future bid book had exactly the same quantities and every bid price rose together, the required midpoint change would be N × (1 + fB) / [S × (1 − fS)] − 1.
That final uniform-shift assumption is deliberately artificial. A real future book is unknown; sellers may withdraw, fills may be partial, and a displayed limit order may never execute. The interactive calculator above uses the simpler spread-plus-impact approximation. Its inputs are explicitly yours, while the table uses a captured 1,000-level book; the two are not falsely presented as identical measurements.
If a buy fee is deducted in the purchased coin rather than in USDT, the exact available sell quantity changes. Check the fee asset and fills in your account. The public table uses a fixed USDT-equivalent fee convention so third parties can reproduce it.
| Input | Where it enters the calculation | Common mistake |
|---|---|---|
| Buy and sell commission | Each side separately, on its own traded notional | Count only the buy fee |
| Spread | Buying asks and selling bids | Treat midpoint or last price as a fill |
| Depth / price impact | More book levels consumed as size rises | Apply the $100 estimate to $10,000 |
| Funding / borrowing | Only when using a funded derivative or borrowed position | Mix perpetual funding into a spot-only example |
| Unfilled limit order | No realized trade until matched | Count a lower displayed maker quote as saved cost before filling |
Verify: Binance fee calculation and account-tier caveats · Full calculation protocol
Why can a larger crypto order need a bigger move?
On the captured BTC book, the $100, $1,000 and $10,000 orders could all be filled near the same top ask and bid levels, so the modeled break-even percentage rounded to 0.200% for each. That is not a permanent BTC liquidity guarantee; it is a property of this one observed book and these sizes.
The selected SAGA book behaved differently. With identical 0.10% each-side fees, the required midpoint move rose from 0.278% at $100 to 0.462% at $1,000 and 0.989% at $10,000. The nominal fee rate never changed; crossing deeper asks and bids produced the difference. DOGE rose modestly from 0.211% at $100 to 0.217% at $10,000.
A small cap's 24-hour volume is not enough to infer its immediate executable depth. Use an amount-specific book, but remember that visible orders can disappear and a 1,000-level snapshot is not a live execution venue or a guarantee of liquidity.
| Observed pair · 0.10% each side | $100 | $1,000 | $10,000 |
|---|---|---|---|
| BTC · midpoint rise required | 0.200% | 0.200% | 0.200% |
| DOGE · midpoint rise required | 0.211% | 0.211% | 0.217% |
| SAGA · midpoint rise required | 0.278% | 0.462% | 0.989% |
Verify: Full order-size CSV · Current order-book liquidity page
What if my crypto trading fee is lower than 0.10%?
With the same retained $1,000 order books but a hypothetical 0.05% fee on both sides, the model's required midpoint change falls to about 0.100% for BTC, 0.100% for ETH, 0.109% for SOL, 0.101% for BNB, 0.111% for DOGE and 0.361% for SAGA. Fee savings do not remove spread or depth cost; the thinner-book comparison remains.
These are fixed sensitivity parameters, not a quoted Binance fee for your account. Maker versus taker, jurisdiction, pair-specific promotions, VIP level and fee-payment asset can all alter the effective rate. Consult the current official fee table and your actual order history; do not substitute an article's example for the fee you pay today.
The scenario also excludes exchange rebates, maker non-fill probability and strategy opportunity cost. A maker limit order can avoid part of the spread if it eventually fills; an aggressive limit order may be a taker. The fee label alone does not settle market-versus-limit choice.
| $1,000 pair | 0.10% buy + 0.10% sell | 0.05% buy + 0.05% sell | Interpretation |
|---|---|---|---|
| BTC | 0.200% | 0.100% | Fee dominates this one deep-book example |
| SOL | 0.209% | 0.109% | Spread remains visible |
| SAGA | 0.462% | 0.361% | Depth remains material after fee reduction |
Verify: Official Binance spot fee schedule · Binance explainer on maker and taker
If crypto rises 0.3%, have I actually made a profit?
Not necessarily. Under this frozen example, a 0.3% uniform future midpoint rise would exceed the modeled $1,000 BTC and ETH break-even thresholds but fall below the selected SAGA $1,000 threshold of 0.462%. The calculation says nothing about whether you could enter or exit at those prices; it is a threshold scenario, not an observed future return.
Even when the paper threshold is crossed, actual net proceeds can differ because the spread widens, book depth vanishes, an order is partially filled, or latency moves the quote. For a limit order, getting a better quoted price can mean no fill at all. For a perpetual contract, funding and liquidation risk add different costs and risks; use the dedicated funding analysis rather than pretending a spot formula covers them.
A practical check before placing a spot order is: write down the intended notional, the two applicable fee rates, the current bid/ask, order-book depth around your size, and the minimum acceptable exit. If any input is stale or unknown, treat the numeric break-even price as an estimate with an explicit gap.
Verify: Funding-rate cost history for perpetual contracts · Current cross-market context
How should you use a crypto break-even calculator before placing an order?
Enter your actual buy fee and expected sell fee separately if they differ, then estimate the entry and exit spread or slippage at your order size. The frozen six-market book study illustrates the principle: under a hypothetical 0.10% fee per side and unchanged book shape, the $1,000 BTC scenario required about a 0.200% midpoint rise while the thinner SAGA book required about 0.462%. A $10,000 SAGA scenario required about 0.989%. These are observed-book scenarios, not quotes for today's order.
A limit order can cap the price you are willing to pay but may remain unfilled; an immediately marketable limit can still take liquidity. A market order can fill promptly but its actual average price depends on the live book and size. The calculator cannot turn either order type into a guaranteed net profit or forecast the future exit book.
Before a small target trade, compare the calculated threshold with a realistic price path and your stop distance. If the intended move is smaller than the total estimated round trip, a green price candle can still be a losing trade. Futures funding, borrowing and liquidation are outside this spot-book calculation.
| Input or execution choice | Why it changes crypto break-even | Limit of the calculator |
|---|---|---|
| Buy and sell fee tiers | Both sides reduce net proceeds; the tiers may differ. | Your exchange account and jurisdiction determine actual rates. |
| Order size and spot-book depth | A larger order may consume worse price levels and raise estimated midpoint movement. | A frozen snapshot cannot guarantee later depth or queue position. |
| Limit versus market order | A limit controls acceptable price; a market order takes available liquidity. | A resting limit may not fill, while a marketable limit can still pay taker costs. |
| Futures or leveraged position | Funding, borrowing and liquidation add different costs and risks. | This spot-book scenario omits them; do not reuse its threshold unchanged. |
Verify: Current crypto order-book liquidity observations · Funding-rate costs for leveraged positions
How can I tell whether the profit calculator output is sensible?
Run an accounting sanity check before using a target: at an unchanged reference price, positive fees and adverse fills should normally produce a loss; a cost-free linear trade at unchanged entry and exit should produce zero price P&L. A signed funding credit is a deliberate exception that can offset costs, not evidence of a price prediction.
At fixed quantity, entry and exit, changing only leverage should leave dollar price P&L unchanged while changing required margin. At fixed margin, increasing leverage increases notional once; do not multiply the resulting dollar P&L by leverage again. For positive net costs, a long generally needs a higher reference exit and a short a lower one, conditional on the same specified fill assumptions.
Compare the fee amounts against actual entry and exit notional, not only the margin deposit. Check that percentage fields and dollar funding are in the correct units. Blank, stale or unsupported inputs cannot establish a zero-cost trade. These checks explain outputs; they do not validate survival to the requested exit or guarantee future depth.
Why does my closed trade profit differ from the chart or calculator?
Actual net profit is reconciled from executed quantities and fills, not the chart’s last price. The estimate can differ because an order fills at multiple levels, fees are paid in another asset, a maker order becomes marketable, settlement cash changes, or part of the position remains open.
Export the entry and exit fills and fee asset amounts; match instrument, direction and position quantity; convert costs under an explicit reporting convention; then add actual signed funding or borrowing where applicable. Separate realized closed quantity from unrealized open quantity. Deposits, withdrawals and reward credits are account transfers, not price profit.
If the ledger still differs, check quantity rounding, partial closes and the venue’s P&L reporting scope before assuming a calculation bug. The spot snapshot cannot reveal your fills or tax basis; inverse contracts and options need a different payoff equation. Report missing account records rather than fill them with zero.
When is a small profit target too small after crypto trading costs?
A target smaller than the estimated full round trip leaves no positive modeled net return under those inputs; a target just above it has little buffer for worse fills. Break-even is a cost boundary, not a probability that the price reaches your target or that the trade is worth taking.
In the frozen $1,000 examples, a 0.3% uniform midpoint shift clears the modeled BTC threshold but not the SAGA threshold. Both use the same 0.10% fee per side; the captured depth and spread make the difference. A larger order or stressed exit can raise the threshold even if the advertised fee remains unchanged.
Compare the net target and maximum acceptable loss using size-specific entry/exit assumptions. If spread, depth or settlement inputs are old, refresh those observations or keep the estimate explicitly conditional. Using a limit order may improve a fill only if it actually executes; waiting has opportunity cost and is not a tested free saving.
Verify: Inspect current size-sensitive crypto order-book liquidity · Compare market and limit order fill risks
Can I verify the crypto break-even calculator's market example?
Yes. The research release includes all six raw 1,000-level books with exchange update IDs and per-symbol UTC collection times, 36 observations in JSON and CSV, the frozen method, SHA-256 file hashes and an independent standard-library replay script. Download the files into one directory and run `python reproduce.py`; the audit re-sweeps both sides of every book and checks 720 numeric fields across JSON and CSV.
The six requests were sequential, not a synchronized cross-exchange measurement. No later trade outcome or profitability claim has been attached to this snapshot. The price-shift formula and the interactive calculator are useful for understanding cost mechanics, while the public inputs let a researcher test the arithmetic and see exactly what the book did—and did not—show.
This study is free to download. It is distinct from CoinNudge's paid historical data products, and no subscription is required to reproduce the point-in-time cost illustration.
| Public file | Evidence it contains |
|---|---|
| book-snapshots.json | Six complete retained 1,000-level books and observed times |
| research.json / observations.csv | All 36 size-and-fee results |
| reproduce.py | Independent sweep and 720 field checks |
| protocol.md / manifest.json | Frozen assumptions and file hashes |
Verify: Original books · Results JSON · Results CSV · Independent replay script · Frozen method · Hash manifest
Take the next step with this evidence.
Choose ongoing Telegram monitoring or inspect structured data in your own research workflow.
Receive qualifying events in Telegram.
Use the ready-made alert checklist, message explanations and daily briefing. Check the supported categories and coins before subscribing; every Research page is not a separate alert category.
Check the alert list · View alert plans
Inspect the data before choosing a pack.
Prepared research packs supply scoped features, separate outcomes where available and quality flags. Buy a fixed edition once and download directly; API use is optional.
Check data pack samples · Explore the full data catalog · Compare data plans
Each purchased pack includes its specified fields and published date range. This page's full dataset is not automatically included. Other data families require coverage, date, field and source-use confirmation before purchase. Telegram Pro is a separate 30-day service; historical packs are one-time purchases.
Frequently asked questions
What is the minimum crypto price increase to break even after fees?
There is no universal number. With hypothetical 0.10% fees on both sides, the retained $1,000 BTC book required about a 0.200% midpoint rise; the selected thinner SAGA book required about 0.462%. Your exact amount, fees, spread and future fill can differ.
Does a 0.2% gain cover two 0.1% trading fees?
Not exactly. Two 0.10% fees compound against different notionals, making the no-spread break-even move slightly above 0.20%; spread, depth and slippage raise it further.
Is a market order always more expensive than a limit order?
A marketable order consumes visible liquidity and may cross the spread. A passive limit order may add liquidity but might never fill; an aggressive limit order can still be a taker. Compare actual fills and your need for execution.
How do I include slippage in a trading break-even calculator?
Enter a conservative estimated impact per side in basis points, separately from the bid–ask spread and fees. This is a scenario input, not a prediction of live slippage.
Do Binance spot fees equal 0.10% for everyone?
No. The article uses 0.10% and 0.05% illustrative per-side rates. Your account tier, pair, promotion, maker/taker role and fee-payment asset can change the actual rate; check the current official schedule and your fills.
Does the frozen spot-book break-even formula include futures funding?
No. The six-book study measures unborrowed spot and excludes funding. The separate linear USDT futures calculator accepts signed accumulated funding cash; borrowing, inverse contracts and liquidation require their own rules.
Why is SAGA's threshold higher in the example?
The captured SAGA book had a wider spread and a $1,000–$10,000 sweep consumed more depth. One snapshot cannot establish that SAGA always has this cost or that it will be untradeable later.
Can I reproduce the exact numbers?
Yes. Six raw Binance book snapshots, 36 result rows, CSV, protocol, hash manifest and an independent replay script are linked in the evidence section; the replay checks 720 numeric fields.
Does 20× leverage make the same position earn twice as much as 10×?
Not when quantity and entry/exit prices stay fixed. It changes opening margin and margin ROI. With fixed margin, however, doubling leverage doubles reference notional and position quantity.
Can this calculator estimate liquidation?
No. Maintenance tiers, mark-price triggers, insurance/ADL and account margin rules are not modeled. A large calculated endpoint loss may be unreachable because liquidation occurs earlier.
Are spot and futures break-even the same?
No. Spot uses purchase/sale fee and spread assumptions; linear futures also has margin, reference notional, signed funding and separate long/short fill equations.
Is return on margin the same as profit on my account?
No. Net profit divided by opening margin, entry notional and whole-account capital has three different denominators. A large margin ROI does not mean the entire account earned that percentage.
Can I use this calculator for inverse futures or options?
No. The contract module uses a linear USDT payoff. Inverse coin-margined contracts, options, borrowed spot and cross-margin liquidation require their own rules.
Sources and verification
- CoinNudge frozen order-book inputSix original source responses and exact UTC observation times.
- CoinNudge audited result36 fixed notional and fee scenarios, without future fill claims.
- Binance spot fee explanationMaker/taker fee mechanics and tier-dependent rates.
- Binance spot market-data endpointsOrder-book depth response and public market-data route.
Check the current market's visible liquidity and your own fee schedule before treating a small price move as profit.
CoinNudge's market radar surfaces current liquidity context; our Telegram alerts monitor qualifying changes, but neither places orders.
Inspect market radar