Historical exit-policy study · By CoinNudge Research · · Guide updated 2026-10-03 · 13 min read
When should you move a crypto stop loss to breakeven?
There is no reliable universal point to move a crypto stop loss to breakeven in this test. Across the same 313 BTC, ETH and SOL spot-breakout entries, moving after +0.5R, +1R or +2R did not establish a better average net return than keeping the original 2% stop: every paired 95% week-cluster interval included zero. The +0.5R rule activated on 201 entries and closed 148 at the cost-adjusted breakeven stop; seven of those entries reached the 6% target under the original-stop policy. The result is about this historical 24-hour simulation, not a stop instruction for your trade.
Preview Telegram alerts · Read the 313-entry source study · Inspect full comparison
What does a breakeven stop actually change after a crypto entry?
- Cost-adjusted breakeven is above the raw buy price: with a 0.15% allowance on each side, the modeled sell stop is entry × 1.0015 / 0.9985, about 0.3005% above entry.
- In 313 common entries, +0.5R, +1R and +2R moving rules had paired average-return differences of −0.0485, −0.0531 and +0.0053 percentage points versus never moving; all three 95% intervals crossed zero.
- Earlier protection sometimes exits a future winner: seven +0.5R and four +1R breakeven exits corresponded to entries that reached the 6% target under the original stop. Two +0.5R stops still lost net because of modeled open gaps.
- This is a retrospective Binance spot OHLC experiment on one selected breakout cohort. It does not reconstruct exchange stop orders, tick sequence, personal fees or leveraged liquidations.
Did moving a crypto stop to breakeven improve average returns?
Not conclusively. On the fixed 313-entry cohort, the original-stop policy averaged −0.0466% net per trade observation. Moving after +0.5R averaged −0.0951%, after +1R averaged −0.0996%, and after +2R averaged −0.0413%. These are observation-level means, not an investable compound portfolio result; the small differences are not evidence of a best policy.
The paired mean differences versus never moving were −0.0485, −0.0531 and +0.0053 percentage points for +0.5R, +1R and +2R. Their UTC-week cluster bootstrap 95% intervals were respectively −0.2245 to +0.1168, −0.1986 to +0.0745 and −0.0153 to +0.0308 percentage points. Each includes zero, so this experiment did not establish that any move timing reliably increases the average outcome.
More positions protected is not the same as more return. A fixed protective stop can preserve room for normal price movement; a moved stop can reduce a later loss but also end a trade before a rebound or target. The policy table keeps both consequences visible.
| Same entry, same initial 2% stop | Moved / 313 | Breakeven exits | Mean net / observation | Paired mean difference 95% interval vs no move |
|---|---|---|---|---|
| Never move | 0 | 0 | −0.0466% | Reference |
| Move after +0.5R | 201 | 148 | −0.0951% | −0.2245 to +0.1168 pp |
| Move after +1R | 119 | 56 | −0.0996% | −0.1986 to +0.0745 pp |
| Move after +2R | 55 | 8 | −0.0413% | −0.0153 to +0.0308 pp |
Which breakeven-stop rule looked best—and was its advantage reliable?
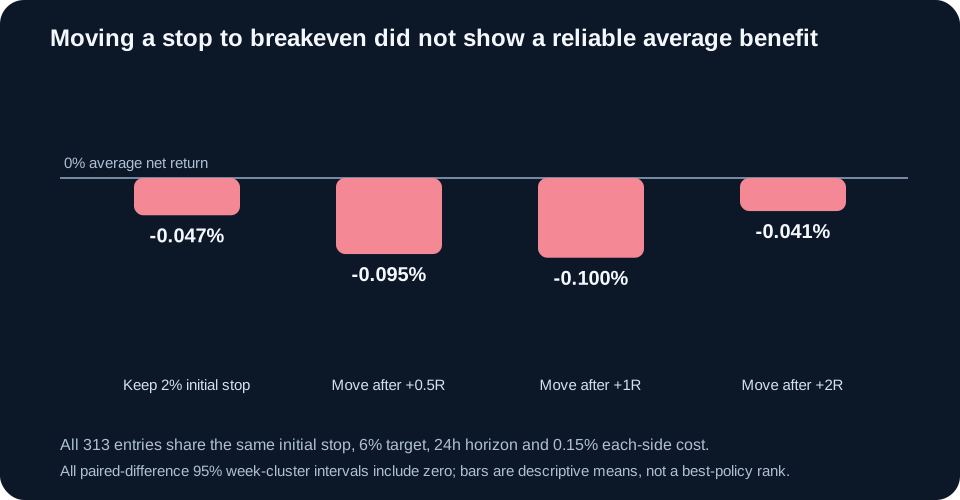
The +2R rule had the least-negative observed mean, −0.0413%, compared with −0.0466% for never moving, −0.0951% for +0.5R and −0.0996% for +1R. But the +2R paired 95% difference interval still included zero; none of the three movement rules established better average net returns on the same 313 entries.
The chart compares observation-level outcomes under identical entry, initial stop, target, horizon and costs. It is not a compound account curve or a basis for selecting +2R after seeing the results. Read the full paired intervals and early-exit counterexamples alongside the bars.
Verify: Frozen four-policy result and uncertainty · All paired entry-policy observations
Is moving a stop to your entry price really breakeven?
No, not after costs. In this spot simulation the allowance is 0.15% on the buy and another 0.15% on the sell, so the net-zero sell price is entry × (1+0.0015)/(1−0.0015), approximately 0.3005% above the raw buy price. A stop placed exactly at entry would generally realize a modeled loss from the round trip.
The reference risk R is the 2% distance from entry to the initial stop. +0.5R means price high first reached entry +1%; +1R means +2%; +2R means +4%. Only the next complete five-minute candle can use the new cost-adjusted stop. If the same bar touched both an existing stop and an activation high, the stop wins because the intrabar order is unknown.
Two +0.5R cases still exited below net breakeven because their later five-minute bar opened below the armed stop. In a fast real market the discrepancy could be larger. A stop is a trigger for an order, not a guaranteed exit price; a stop-limit trades price control for non-fill risk.
| Fixed term | Exact rule | Why a trader should care |
|---|---|---|
| Initial stop | Entry −2% | Same for all four policies |
| Net breakeven stop | Entry × 1.0015 / 0.9985 | Includes both modeled cost sides |
| Activation | +0.5R / +1R / +2R on a five-minute high | New stop becomes effective next bar |
| Profit target | Entry +6% (3R) | Fixed, not optimized per moving policy |
| Maximum hold | 24 hours; next open if still in position | Same endpoint opportunity for all policies |
| Ambiguous bar | Active stop before target | Conservative but not tick-accurate |
Verify: Order-trigger and fill limitations · Frozen study protocol
When can a breakeven stop remove a trade that later works?
In this exact 24-hour experiment, seven +0.5R breakeven exits and four +1R exits came from entries that later reached the fixed +6% target under the unchanged-stop policy. That is a concrete cost of moving the stop early—not evidence that those future winners could be identified in advance. The complete ledger identifies each paired observation so readers can inspect both paths.
The reverse also exists: on other entries an activated breakeven stop limited the modeled loss while the unchanged stop subsequently lost more. A person remembering only the trade that recovered after their stop would miss these protected losses. The right decision is not inferred from either anecdote but from the full paired sample and the risk budget of the strategy.
The +2R policy activated only 55 times and exited eight at the moved stop, so it is closer to never moving. Its slightly higher observed mean is not a robust superiority claim: its paired 95% interval, −0.0153 to +0.0308 percentage points, still includes zero.
| Policy | Moved-stop exits | Those entries hitting target under original stop | What this does not mean |
|---|---|---|---|
| Move after +0.5R | 148 | 7 | Not all 148 were mistakes; many original paths were worse |
| Move after +1R | 56 | 4 | Not a forecast of which four will recover |
| Move after +2R | 8 | 0 | Small active subset; no proof this timing is best |
Verify: Frozen four-policy result and uncertainty · All paired entry-policy observations
Did Bitcoin, Ethereum and Solana show the same pattern?
No, and the difference cautions against a universal percentage rule. The baseline mean was −0.1241% for 107 BTC entries, −0.1111% for 102 ETH entries, and +0.0964% for 104 SOL entries. Moving after +0.5R reduced the descriptive mean in each of the three coin subsets, but these markets share time periods and broad risk conditions; treating their paths as three independent confirmations would overstate the evidence.
The first 151 entries and the later 162 also had different absolute results. With +1R movement, the first-half mean was −0.1019% and second-half mean −0.0975%. The high-volatility subgroup was especially sensitive to +1R, but multiple subgroup views increase false-discovery risk. These are diagnostic splits, not a personalized rule for BTC, ETH or SOL.
This selected cohort contains only Binance spot hourly breakout entries that passed the earlier common-distance and 48-hour completeness conditions. Smaller, illiquid, newly listed or delisted coins may have very different gaps and execution costs; the experiment does not describe them.
| Historical subset | Entries | No move mean | +0.5R mean | +1R mean | +2R mean |
|---|---|---|---|---|---|
| BTC | 107 | −0.1241% | −0.1892% | −0.1510% | −0.1275% |
| ETH | 102 | −0.1111% | −0.1629% | −0.1604% | −0.1107% |
| SOL | 104 | +0.0964% | +0.0683% | +0.0127% | +0.1154% |
| First half | 151 | −0.0604% | −0.0941% | −0.1019% | −0.0680% |
| Second half | 162 | −0.0337% | −0.0959% | −0.0975% | −0.0164% |
Verify: Frozen four-policy result and uncertainty · All paired entry-policy observations
How were the 313 entries and the uncertainty interval calculated?
We reused all 313 completed BTC/ETH/SOL hourly-breakout entries from the previously published stop-loss study, whose public candidate ledger includes rejected, cooled-down and pending signals. The underlying retrospectively recovered Binance spot data comprise complete five-minute paths from September 1, 2025 through September 18, 2026 UTC. This new policy question did not change that cohort after seeing the outcomes. It should not be generalized to every trade entry or a point-in-time trading account.
For each entry, four policies use an identical initial −2% stop, +6% target, 24-hour maximum and 0.15% each-side allowance. On each five-minute candle, the active stop is checked before the target; only if neither exits do we consider arming a higher stop for the following candle. At the 24-hour boundary, any remaining position exits at the next open. Returns are sell proceeds net of cost divided by buy cost minus one; no leverage or position compounding is modeled.
We compare each moving policy with never moving on the same entry. The 95% interval resamples complete UTC ISO weeks across coins 1,000 times using Python Random(20260925); this preserves some same-week dependence but not all serial correlation. The intervals are unadjusted for three policy comparisons or multiple subgroup views. They describe uncertainty around this selected cohort, not future win probabilities.
Verify: Earlier stop-loss research and source cohort · Original candidate and candle evidence · New protocol
How should a trader use this finding without treating it as a signal?
Write the reason for the initial trade and initial invalidation before entry. If you plan to move a stop, specify exactly what confirms the move, whether your breakeven level includes both sides of costs, what happens on an opening gap, and how much account capital the initial stop risks. That makes the policy testable instead of a reaction to a frightening candle.
Inspect whether your own trade horizon, volatility and execution conditions resemble this study's hourly breakout and 24-hour spot holding period. If not, the observed percentages are not a portable decision rule. Use the original-stop path and the early-exit counterexamples together; do not select a threshold from whichever column looks best in one completed sample.
CoinNudge market alerts can help you notice a change in volatility or price structure, but they do not place, move or guarantee a stop order. If you need automated execution, evaluate the exchange's order rules and your risk controls separately.
Verify: Frozen four-policy result and uncertainty · All paired entry-policy observations
How do you write a breakeven-stop rule that can be tested fairly?
Define the initial risk, activation trigger, cost-adjusted exit level, effective time and gap handling before entering. 'Move it when the trade feels safe' is not reproducible; changing the trigger after a favorable excursion changes the experiment.
In the published comparison, R is the original 2% price distance, not a fraction recalculated from a newly moved stop. Activation at +0.5R, +1R or +2R arms the higher stop only for the next complete 5m candle. Keep the same entry and opportunity set when comparing policies, including trades never activated and those stopped before activation.
Outside this study, insert your actual fee convention, order type, instrument and holding period. The frozen cost-adjusted formula assumes a spot buy/sell model; futures funding, leverage and liquidation are not included. If costs or the order sequence are unknown, retain that uncertainty instead of advertising a guaranteed zero-loss stop.
Verify: Frozen activation timing, R and four-policy results · Order types and fill risks
Can a breakeven stop reduce some losses without improving the strategy?
Yes. Reducing the loss on one path and improving average return across the same entries are different objectives. An early exit can protect a trade that later falls, yet also remove a trade that recovers; the seven +0.5R early exits that reached the target under the original stop are concrete paired counterexamples.
Choose the objective before comparing: average net observation return, loss size, drawdown or account exposure. The published table and ledger support the specified 24h observation-policy comparison, not a capital-constrained compounded portfolio or a personalized acceptable drawdown. A threshold should not be chosen merely because its name promises 'breakeven'.
If reducing a particular account risk matters more than the tested mean, formulate that risk measure and test it separately without rewriting the old 313-entry result. Keep protected losses, missed target outcomes and opening-gap failures visible. A future-held-out evaluation is needed before calling a policy an improved trading rule.
Verify: Complete paired outcome ledger · Mean differences and week-cluster intervals
Can I reproduce the breakeven-stop experiment?
Yes. Download this edition's complete `research.json`, all 1,252 observation rows in `observations.csv`, and the standard-library reproduction program. The original input candles and original 313-entry candidate ledger remain in their immutable earlier release; the new manifest records both source hashes. Run `python reproduce.py ORIGINAL_RESEARCH_JSON ORIGINAL_CANDLE_ZIP OUTPUT_JSON` against those downloads. This release uses the prior evidence rather than duplicating a large ZIP under a new URL.
An independently written audit checked all 313 cases, all 1,252 policy paths and 6,268 path/return/mean fields with no mismatches. The audit validates arithmetic against the published five-minute candles. It cannot reconstruct tick order, actual exchange fills or the future profitability of changing stops.
Research evidence is public. Commercial alerts and fixed-edition data packs have separate coverage; buying either does not provide a real-money stop-order service.
| Evidence | File or prior release | What it contains |
|---|---|---|
| New result | research.json | Policy results, splits, intervals and all observations |
| Observation ledger | observations.csv | 313 entries × 4 policies; no selected winners only |
| Original source | Earlier stop-loss research and candle ZIP | Candidate status and raw historical paths |
| Reproduction | reproduce.py + protocol.md | Fixed rules, costs and executable study |
| Integrity | manifest.json | Input source and current artifact hashes |
Verify: Full new result JSON · Observations CSV · Reproduction program · Original candle ZIP · Manifest
Take the next step with this evidence.
Choose ongoing Telegram monitoring or inspect structured data in your own research workflow.
Receive qualifying events in Telegram.
Use the ready-made alert checklist, message explanations and daily briefing. Check the supported categories and coins before subscribing; every Research page is not a separate alert category.
Check the alert list · View alert plans
Inspect the data before choosing a pack.
Prepared research packs supply scoped features, separate outcomes where available and quality flags. Buy a fixed edition once and download directly; API use is optional.
Check data pack samples · Explore the full data catalog · Compare data plans
Each purchased pack includes its specified fields and published date range. This page's full dataset is not automatically included. Other data families require coverage, date, field and source-use confirmation before purchase. Telegram Pro is a separate 30-day service; historical packs are one-time purchases.
Frequently asked questions
When should I move my crypto stop loss to breakeven?
This 313-entry BTC/ETH/SOL study found no reliably superior timing among +0.5R, +1R and +2R moves versus retaining the original stop. Write and test a policy suited to your own entry, costs and risk rather than using a universal threshold.
Is a stop at my purchase price actually breakeven?
Usually not after fees and slippage. At a modeled 0.15% cost on each side, the net-zero exit is about 0.3005% above the raw purchase price, before any adverse opening gap.
Did moving at +1R improve average results?
No advantage was established. The +1R policy averaged −0.0996% net per observation versus −0.0466% for no move; its paired-difference 95% interval included zero.
Can a breakeven stop get hit before the target?
Yes. Four +1R and seven +0.5R breakeven exits were entries that reached the fixed +6% target under the original-stop policy in this sample. The reverse protected-loss cases also exist.
Can I still lose money with a breakeven stop?
Yes. A stop is not a guaranteed fill price. Two +0.5R cases in this OHLC model exited at a later open below the active net-breakeven stop and realized a net loss.
Were the rules optimized after looking at the outcomes?
No. The source cohort, +0.5R/+1R/+2R thresholds, 2% initial stop, 6% target, 24h window, costs, next-bar activation and week-cluster interval were written down before this result was calculated.
Does the research include perpetual futures or stop-limit orders?
No. It uses retrospectively recovered Binance USDT spot five-minute candles and a simplified market-stop fill convention. Funding, leverage, mark-price triggers, queue priority and actual order execution are not modeled.
Where can I download the underlying data?
This article links the new 1,252-row observation ledger, exact study script and manifest; the original 313-entry candidate research and candle ZIP remain available from the earlier stop-loss release.
Sources and verification
- CoinNudge prior stop-loss source cohort313 selected breakout entries and original frozen five-minute inputs.
- CoinNudge new frozen protocolPolicies, costs, horizon, activation order and uncertainty fixed before the result.
- CoinNudge full policy ledgerFour exits on each common entry and stratified summaries.
- Investor.gov order-types bulletinGeneral stop-market and stop-limit execution limitations, not a Binance-specific fill guarantee.
See market changes without mistaking an alert for an automatic stop order.
Compare our supported Telegram alerts and their evidence before deciding what you will do with a position.
Explore alert coverage