Historical decision study · By CoinNudge Research · · Guide updated 2026-10-03 · 16 min read
Why Does Your Crypto Stop Loss Hit Before a Reversal?
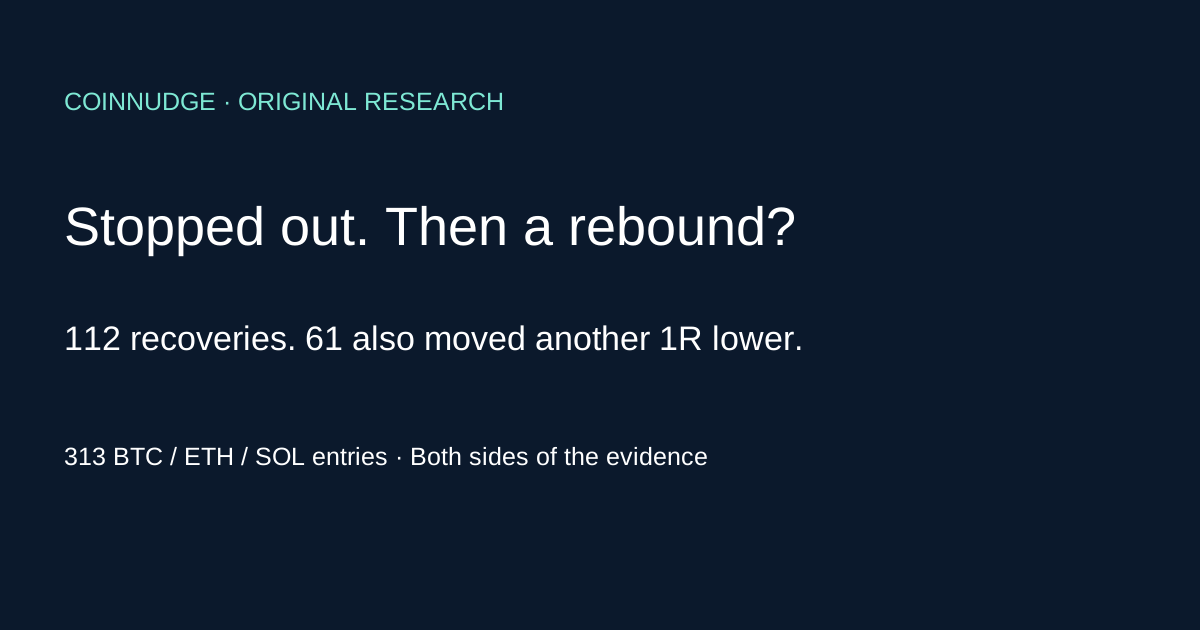
A stop can trigger inside ordinary volatility and still be followed by a rebound—but recovery alone does not prove the stop was wrong. In 313 BTC/ETH/SOL breakout entries, a 1% stop triggered 190 times; 112/190 (58.9%) recovered the entry price within the next 24 hours. Of those recoveries, 61 also crossed another 1R lower. Wider stops reduced triggers, but none showed a clear average-return advantage over 24-hour holding after costs.
Preview alert list · Explore research data · See alert plans
Why can a crypto stop loss hit before a reversal?
- 313 breakout entries; 190 triggered 1% stops; 112 recovered within 24h.
- 61 stopped paths both recovered and crossed another original risk distance lower.
- One historical period; simulated fills, not live execution or a universal best stop.
Why can a crypto stop loss trigger before price rebounds?
A stop can trigger inside ordinary volatility and still be followed by a rebound—but recovery alone does not prove the stop was wrong. In 313 BTC/ETH/SOL breakout entries, a 1% stop triggered 190 times; 112/190 (58.9%) recovered the entry price within the next 24 hours. Of those recoveries, 61 also crossed another 1R lower. Wider stops reduced triggers, but none showed a clear average-return advantage over 24-hour holding after costs.
Only 21/190 (11.1%) stopped cases recovered within one hour; 57/190 (30.0%) within four hours. “It bounced after my stop” and “it immediately reversed” are different claims. The 24h recovery estimate has a week-clustered 95% interval of 51.7%–65.5% in this sample, not a forecast for your next trade.
Here, recovery means at least one completed 5m close at or above the original entry price. It does not mean the price stayed there, reached a profit target or covered trading costs. Another 1R means a low one original entry-to-stop distance below the stop. The trigger candle itself is excluded from follow-up because its high/low sequence is unknown.
| After a 1% stop: next 24h | Cases | Share of 190 stops |
|---|---|---|
| Recovered; no further 1R drop | 51 | 26.8% |
| Another 1R drop; no recovery | 63 | 33.2% |
| Both recovery and another 1R drop | 61 | 32.1% |
| Neither threshold reached | 15 | 7.9% |
Is 1%, 2% or an ATR stop better for crypto?
There is no universal best stop-loss percentage in these results. Every rule below uses the same eligible entry cohort. Changing stop distance changes how frequently normal price movement exits the position, how much an unscaled position can lose and how many rebounds remain investable.
The 24h no-stop benchmark averaged -0.12% per observation, median -0.23%. The paired average differences below all have intervals spanning zero. Fewer triggers are not evidence of better profitability, and a positive difference relative to a losing benchmark need not be positive absolute profit. These are observation returns, not compounded portfolio returns.
| Stop policy | Triggered / entries | Recovered / stops | Mean net | Difference vs hold: 95% interval |
|---|---|---|---|---|
| Fixed 1% | 190/313 (60.7%) | 112/190 (58.9%) | -0.07% | -0.20 to +0.33 pp |
| Fixed 2% | 111/313 (35.5%) | 43/111 (38.7%) | -0.08% | -0.14 to +0.25 pp |
| 2 × hourly ATR(14) | 161/313 (51.4%) | 80/161 (49.7%) | -0.07% | -0.13 to +0.27 pp |
| 20h low − 0.25 ATR | 61/313 (19.5%) | 20/61 (32.8%) | -0.16% | -0.15 to +0.10 pp |
A wider stop needs a different position size—not a bigger cash loss
On the same position value, moving a stop from 1% to 2% approximately doubles price risk before costs. A fair risk-budget comparison reduces the amount invested rather than quietly giving the wider stop more capital at risk.
For initial account capital C, the simulated allocation is min(1, 0.01 / L), where L = 1 − (stop/entry) × (1−cost)/(1+cost). Uninvested cash earns zero. This targets 1% of account capital lost at the modelled stop fill, including cost, and never borrows. A gap below the stop can still exceed that target. The no-stop benchmark has no comparable predefined stop-risk budget.
For example, at the 0.15% each-side cost allowance, a raw 1% stop represents about 1.30% loss on deployed money, so approximately 77.1% of capital is allocated. A raw 2% stop allocates approximately 43.6%. These are arithmetic illustrations, not personal position-size recommendations.
| Policy | Full-position 10th percentile | 1% risk-budget mean | 1% risk-budget 10th percentile |
|---|---|---|---|
| Fixed 1% | -1.30% | -0.05% | -1.00% |
| Fixed 2% | -2.29% | -0.03% | -1.00% |
| 2 × hourly ATR(14) | -2.25% | -0.01% | -1.00% |
| 20h low − 0.25 ATR | -3.43% | -0.02% | -1.00% |
Does the rebound frequency differ between Bitcoin, Ethereum and Solana?
Rebound frequency differed across the tested Binance spot coins: after a 1% stop, 25/56 BTC, 39/63 ETH and 48/71 SOL stopped entries recovered the raw entry within the next 24 hours. A shared percentage stop is not a shared amount of ordinary volatility; these conditional counts apply to the disclosed hourly breakout entry, not to all trades in those assets.
These are descriptive per-coin results from one historical period. They do not prove SOL will rebound after your stop, nor represent smaller, newly listed or delisted tokens. Per-coin small subsets and multiple comparisons limit inference.
| Market | Eligible entries | 1% stops | Recovered / 1% stops | 2 ATR stops | Recovered / ATR stops |
|---|---|---|---|---|---|
| BTCUSDT | 107 | 56 | 25/56 (44.6%) | 54 | 27/54 (50.0%) |
| ETHUSDT | 102 | 63 | 39/63 (61.9%) | 57 | 30/57 (52.6%) |
| SOLUSDT | 104 | 71 | 48/71 (67.6%) | 50 | 23/50 (46.0%) |
Does market volatility change the story?
Higher pre-entry volatility coincided with more 1% stop triggers and more subsequent rebounds, but not better mean returns here. The high-volatility group had 100/137 stops and 65/100 recoveries; the ordinary group had 90/176 stops and 47/90 recoveries. Their 1%-stop mean returns were −0.28% and +0.10%, respectively, after the model's costs. A higher rebound fraction is therefore not an instruction to tolerate every stop.
Volatility is defined before entry: arithmetic hourly ATR(14) / signal close at least 0.75% is high; below is ordinary. Time halves split the fixed input period at its midpoint. These are descriptive overlapping comparisons, not optimized filters or unseen validation. No future return decides the group.
Breakout entries mechanically tend to sit above a short moving average, so an above/below SMA20 split supplies little independent evidence for this entry rule. The download keeps even empty groups. We do not invent a “multi-indicator confirmation” from redundant conditions.
| Predefined group | Entries | 1% stopped | Recovered / stops | 1% mean net | 2 ATR mean net |
|---|---|---|---|---|---|
| high | 137 | 100 | 65/100 (65.0%) | -0.28% | -0.29% |
| ordinary | 176 | 90 | 47/90 (52.2%) | +0.10% | +0.10% |
| first half | 151 | 96 | 60/96 (62.5%) | -0.06% | -0.10% |
| second half | 162 | 94 | 52/94 (55.3%) | -0.07% | -0.04% |
Would a different entry rule or higher fees change the conclusion?
Entry definition and execution costs can change the observed stop outcomes, so the breakout percentages cannot be transferred unchanged to every purchase. The prespecified Monday 00:00 UTC sensitivity retains 140 common-distance-eligible starts; 59/87 triggered 1% stops recovered. That is a different entry cohort, not a matched no-signal control or proof that scheduled buying is better.
Cost sensitivity preserves all entry times, stop levels and fills, then changes each-side fee/slippage allowance. The assumptions are not Binance account-specific commissions. Faster markets may be more expensive; zero funding is appropriate only to this fully funded spot model. No leverage, borrowing, tax or funding payments are included.
| Each-side cost | 1% mean net | 2% mean net | ATR mean net | Structure mean net |
|---|---|---|---|---|
| 0.05% | +0.13% | +0.12% | +0.13% | +0.04% |
| 0.15% | -0.07% | -0.08% | -0.07% | -0.16% |
| 0.30% | -0.37% | -0.37% | -0.37% | -0.46% |
BTC: a later rebound did not reverse the realized stop loss

The BTC case shows why a rebound can make a stop feel premature without proving that keeping the same exposure was profitable. Entry was 2026-04-20T18:00:00Z at 75,898.14000 USDT; fixed stop 75,139.15860; trigger-bar start 2026-04-21T17:15:00Z. Stop-policy net return was −1.30%, while the common 24h no-stop exit was still a loss at −0.76%. The separate post-stop 24h path category was recovery only; that follow-up can end later than the hold comparison.
The first panel shows completed closes, so a low-wick trigger can occur without a close below the stop. The second panel preserves lows and the further-downside threshold. The last panel keeps proceeds in cash after exit. E marks entry, S the end of the trigger bar (not an exact tick), X the common hold exit; post-stop follow-up can extend beyond X.
Each category uses its middle observation in time, not its most spectacular outcome. These three paths explain mechanisms; the full 313-entry table, not three illustrations, supplies the aggregate evidence.
ETH: the stop limited a decline that did not recover within follow-up

The ETH case is the counterexample to removing a stop because price might rebound. Entry was 2026-03-28T14:00:00Z at 2,026.39000 USDT; fixed stop 2,006.12610; trigger-bar start 2026-03-28T22:10:00Z. The stop-policy net return was −1.30%, versus −2.23% at the common 24h no-stop exit. The separate post-stop path crossed another original risk distance lower without recovering entry during its 24h follow-up; it does not claim recovery never occurred afterward.
The first panel shows completed closes, so a low-wick trigger can occur without a close below the stop. The second panel preserves lows and the further-downside threshold. The last panel keeps proceeds in cash after exit. E marks entry, S the end of the trigger bar (not an exact tick), X the common hold exit; post-stop follow-up can extend beyond X.
Each category uses its middle observation in time, not its most spectacular outcome. These three paths explain mechanisms; the full 313-entry table, not three illustrations, supplies the aggregate evidence.
SOL: the same post-stop path both recovered and fell another 1R

The SOL case shows that a rebound and further loss can coexist; recording only the rebound hides the risk of remaining in the position. Entry was 2026-01-13T23:00:00Z at 146.96000 USDT; fixed stop 145.49040; trigger-bar start 2026-01-13T23:35:00Z. The stop-policy return was −1.30%, versus −0.82% at the common 24h no-stop exit. Its separate post-stop 24h path reached both the raw entry and another original risk distance below the stop; a bar-level chart may not establish the order of simultaneous touches.
The first panel shows completed closes, so a low-wick trigger can occur without a close below the stop. The second panel preserves lows and the further-downside threshold. The last panel keeps proceeds in cash after exit. E marks entry, S the end of the trigger bar (not an exact tick), X the common hold exit; post-stop follow-up can extend beyond X.
Each category uses its middle observation in time, not its most spectacular outcome. These three paths explain mechanisms; the full 313-entry table, not three illustrations, supplies the aggregate evidence.
Was my stop hunted? What these candles cannot establish
A wick through a stop followed by a bounce does not identify who traded, whether anyone knew your order, or whether the movement was manipulative. This dataset contains candles, not account orders, identities or order-book queue positions. It cannot diagnose stop hunting.
A stop-market order prioritizes an exit after triggering, not a guaranteed price. A stop-limit order can constrain price but fail to execute if the market moves away. Venue-specific trigger references can use last, mark or index prices; this study uses Binance spot OHLC lows and therefore cannot be applied directly to a perpetual-contract liquidation or mark-price stop.
The model fills at the lower of stop price and trigger-bar open, then charges a cost allowance. It handles observable open gaps but cannot reconstruct intrabar liquidity or slippage. There is no stop re-entry rule, trailing stop, move-to-breakeven or take-profit leg in this edition.
Should you buy back after being stopped out—or widen the next stop?
A return to entry is not a tested re-entry signal, and widening the next stop is not a free repair of the previous loss. The frozen Binance BTC/ETH/SOL study exits to cash after a stop; it does not test buying back, averaging down, trailing stops or moving protection to break-even. Reusing the 112/190 recovery count as a re-entry win rate would change the strategy and denominator.
Before a new trade, check whether the original setup is valid again on your chosen completed timeframe, whether the trigger came from last, mark or index price, and whether current liquidity supports an exit at your size. Specify a new entry, invalidation, observation window, maximum retry count and fee-inclusive risk budget. A fresh closed-bar signal may justify testing a new rule; wanting the earlier loss back is not a market condition.
For a wider invalidation distance, reduce position size before entry rather than moving the live stop farther away at unchanged size. If the new level makes the loss budget or reward/risk unacceptable, the alternative is no re-entry. For a moved-to-break-even stop, include buy and sell costs: the original raw entry price is not the net break-even price. See the separate break-even-stop study for its own rules and evidence; no superiority for that intervention is established here.
Verify: When moving a crypto stop to break-even helps or hurts · Fee-adjusted spot and leveraged trade break-even
Research method: closed hourly signals, five-minute paths and explicit exclusions
Inputs are 330,912 five-minute candles: 110,304 each for BTCUSDT, ETHUSDT and SOLUSDT on Binance spot, September 1, 2025 00:00 UTC to September 19, 2026 00:00 UTC exclusive. All three expected timestamp grids are complete. Input rows were recovered retrospectively; they are not first-known point-in-time order records.
Twelve complete 5m candles form each UTC hour. A breakout requires an hourly close strictly above the highest high of the preceding twenty complete hours. Entry uses the next hour open. A 48h per-symbol cooldown begins when a candidate is retained, before examining its outcome; repeated signals remain in the ledger as cooldown exclusions.
ATR(14) here is the arithmetic mean of fourteen hourly true ranges, with TR=max(high−low, abs(high−previous close), abs(low−previous close)). It is not Wilder recursive ATR. The structural stop is the preceding twenty-hour low minus 0.25 ATR. All four stop distances must lie between 0.25% and 15% of entry so the comparison cohort is identical. This condition excludes some unusually quiet or wide-range opportunities.
Breakout ledger: {'complete': 313, 'cooldown': 882, 'invalid_common_distance': 2, 'pending': 3}. Scheduled-entry ledger: {'complete': 140, 'invalid_common_distance': 22}. Hourly warmup periods cannot form candidates. All retained observations require a complete 48h path plus endpoint; pending and missing outcomes are not zero returns. Stops operate during the first 24h only, followed by cash; a position that never stops exits at the 24h open.
Follow-up begins with the next full 5m candle after the trigger candle and runs for 288 candles. Recovery uses close≥entry; further downside uses low≤2×stop−entry. Both can occur. If both first occur on one bar, order is unknown. The recovery clock is measured from the end of the trigger bar; the exact tick is unavailable.
For uncertainty, observations in the same UTC ISO week, across symbols, are resampled as a cluster. Python Random(20260919), 1,000 draws with replacement, linear 2.5/97.5 percentiles; at least 20 observations and eight weeks are required. Return intervals are paired policy-minus-hold mean differences; recovery intervals condition on triggered cases. Cross-week dependence, selection and unadjusted multiple comparisons remain limitations. No training, optimization or held-out validation is claimed.
Before changing a stop after a frustrating reversal
First distinguish the chart’s last price from the venue’s actual trigger reference. Then express the stop in both percentage and pre-entry ATR units. A percentage that looks generous on BTC may be ordinary noise on a more volatile coin.
Next separate stop placement from account risk: a farther invalidation level usually requires less exposure to preserve a loss budget. Check what a gap and two-sided costs do to that budget. Removing the stop changes the risk policy; it does not undo the original loss.
Finally record both subsequent recovery and additional downside, not only the peak reached after you sold. Our evidence contains 61 cases that did both. Re-entering would be a new rule needing its own costs and validation, not a free recovery of a missed move.
Download the complete experiment—not just the favourable examples
Download candle-inputs.zip and stop_loss_study.py. Extract the ZIP into a directory and run: python stop_loss_study.py INPUT_DIRECTORY reproduced.json. Compare with research.json. The standard-library program recreates candidate selection, policies, groups, cost sensitivities and confidence intervals without network access. Input hashes are in input-manifest.json; artifact hashes are in manifest.json.
candidates.csv preserves every formed signal, including exclusions. outcomes.csv contains one completed entry × stop policy per row. CSV nested fields use JSON strings. Returns are fractions, not percentages; missing values are empty CSV fields or JSON null. Times are explicit UTC; input capture time is separate from historical event time. chart-data.json includes every plotted coordinate and case selection rule.
These public files are free research evidence and need no purchase. Commercial products are separate one-time fixed-edition data packs with 90-day hosted download and optional API access; a key does not grant live updates or additional files. Check the single data coverage directory and sample for the purchased edition. This specific simulation is not an execution service or an automatic paid-API entitlement.
| Field | Meaning |
|---|---|
| triggered | Whether a 5m low reached the fixed stop within the first 24h. |
| recovered_24h | A subsequent 5m close reached original raw entry, excluding the trigger bar. |
| adverse_24h | A subsequent low crossed one additional original stop distance. |
| risk_budget_return | Account return with cost-aware 1% planned stop risk and cash remainder. |
| net_return / hold_return | Same-notional 24h policy return and no-stop comparison, including costs. |
Verify: Full research JSON · Candidate ledger CSV · Policy outcomes CSV · Summary CSV · Frozen candle inputs ZIP · Reproduction program · Input coverage and hashes · Chart coordinates · Preset protocol · Artifact integrity manifest
Take the next step with this evidence.
Choose ongoing Telegram monitoring or inspect structured data in your own research workflow.
Receive qualifying events in Telegram.
Use the ready-made alert checklist, message explanations and daily briefing. Check the supported categories and coins before subscribing; every Research page is not a separate alert category.
Check the alert list · View alert plans
Inspect the data before choosing a pack.
Prepared research packs supply scoped features, separate outcomes where available and quality flags. Buy a fixed edition once and download directly; API use is optional.
Check data pack samples · Explore the full data catalog · Compare data plans
Each purchased pack includes its specified fields and published date range. This page's full dataset is not automatically included. Other data families require coverage, date, field and source-use confirmation before purchase. Telegram Pro is a separate 30-day service; historical packs are one-time purchases.
Frequently asked questions
Why does my crypto stop loss hit before a reversal?
A stop can sit inside normal volatility. Here 112 of 190 triggered 1% stops recovered the entry within 24h, but 61 also crossed another 1R lower. Recovery alone does not establish a bad stop.
What is the best stop-loss percentage for crypto?
No universal percentage was established. Fixed 1%, fixed 2%, 2× hourly ATR and a structural stop all had paired average-return intervals versus holding that included zero.
Is a 1% stop too tight for Bitcoin?
In the BTC subset it triggered 56/107 entries; 25/56 subsequently recovered. This applies only to the tested hourly breakout and 24h horizon, not every Bitcoin trade.
Is ATR better than a fixed percentage stop?
It scales distance to recent range, but this experiment did not establish superior average returns. The ATR definition, timeframe and position size must be specified.
Should I remove my stop if the price always comes back?
This sample did not always recover. Among 190 triggered 1% stops, 63 moved another 1R lower without recovering within 24h. Removing protection changes loss exposure.
Does a bounce after my stop prove stop hunting?
No. Candles cannot identify intent, order visibility or counterparties. A bounce is not proof of manipulation.
Does a wider stop mean a safer trade?
Not on unchanged position size. A wider stop permits a larger cash loss; the equal-risk comparison cuts exposure and still cannot guarantee fills during gaps.
What is the difference between stop-market and stop-limit?
A triggered market stop does not guarantee an execution price; a stop-limit can fail to fill. This study models a market-style exit with an explicit cost allowance, not a limit-fill guarantee.
Can I use this for futures or leveraged positions?
Not directly. These are fully funded Binance spot simulations. Mark/index triggers, funding, margin and liquidation are not modelled.
How can a researcher reproduce the results?
Download the frozen BTC/ETH/SOL candles, candidate ledger, outputs and standalone program. The files disclose exclusions, raw precision, costs, week-cluster bootstrap and checksums.
Should I immediately buy back after my stop loss triggers?
A rebound is not a validated re-entry rule here. The study stays in cash after a stop, and 61 stopped paths both recovered and fell another original risk distance. Define a fresh setup, invalidation, retry limit and new costs before testing re-entry.
Does a stop at my entry price guarantee break-even?
No. Entry and exit fees, adverse slippage and gaps can leave a net loss at the raw entry price. Moving the stop to break-even was not tested in this frozen experiment; it has its own separately linked research.
Sources and verification
- Binance spot market-data fieldsOHLCV field and interval definitions; research inputs frozen separately.
- Investor.gov order typesGeneral execution distinction; stock-market explanation, not a Binance-specific execution guarantee.
Follow volatility without turning every wick into a trade.
Preview supported Telegram alerts and inspect research evidence before subscribing.
Explore alert coverage