Historical decision study · By CoinNudge Research · · Guide updated 2026-10-03 · 28 min read
How Long Should You Hold Bitcoin? Loss Rates by Holding Period
Historical loss risk fell materially with time, but the curve was not smooth and the path stayed severe. In 3,322 completed Binance BTCUSDT daily candles, 1046/2957 (35.4%) of one-year starts and 634/2592 (24.5%) of two-year starts still ended below the cost-adjusted entry. On the 30-day grid, the first horizon with a loss rate below 10% was 930 days; zero-loss points appeared later but were not monotonic until the mature long-horizon region. All 1,862 four-year starts ended positive, with a worst terminal return of +30.9%, while the median path still suffered a -76.6% peak-to-trough drawdown. Coinbase reproduced the same four-year 0/1,862 loss count.
Preview alert list · Explore research data · See alert plans
Key points
- Four years: 0/1,862 negative endpoints on both Binance and Coinbase—but not a guarantee.
- Two years: 634/2592 (24.5%) negative; one year: 1046/2957 (35.4%).
- The first sub-10% loss-rate point on the 30-day grid was 930 days.
- Four-year median sampled max drawdown: -76.6%.
How long did holding Bitcoin reduce historical endpoint losses?
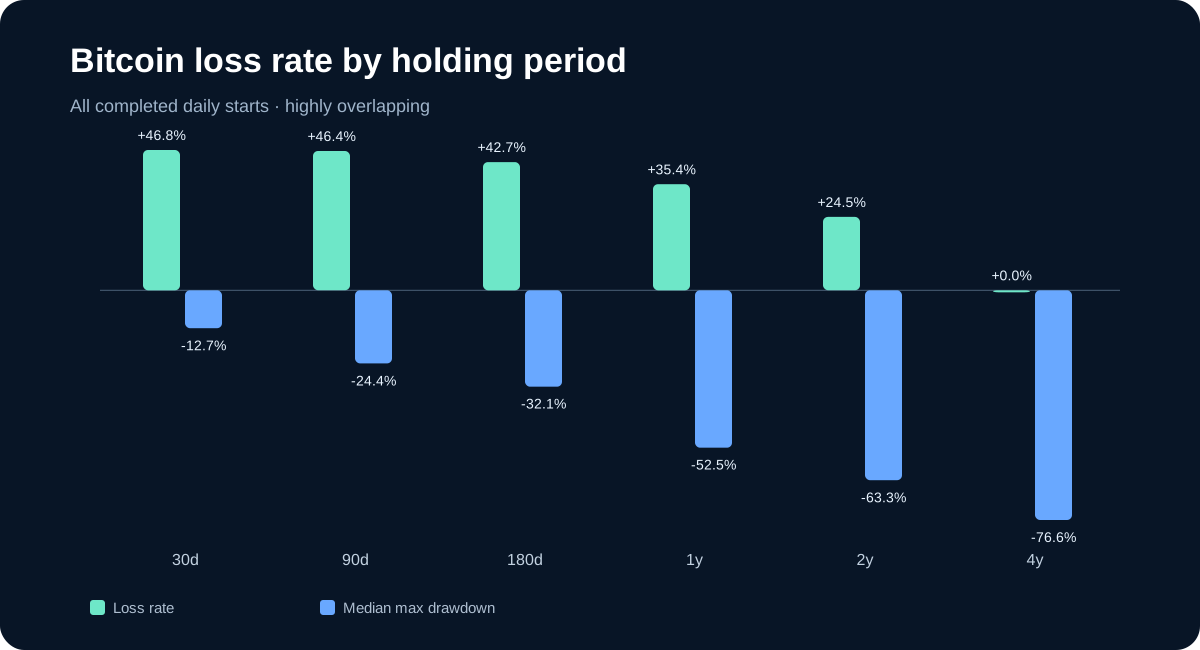
Historical loss risk fell materially with time, but the curve was not smooth and the path stayed severe. In 3,322 completed Binance BTCUSDT daily candles, 1046/2957 (35.4%) of one-year starts and 634/2592 (24.5%) of two-year starts still ended below the cost-adjusted entry. On the 30-day grid, the first horizon with a loss rate below 10% was 930 days; zero-loss points appeared later but were not monotonic until the mature long-horizon region. All 1,862 four-year starts ended positive, with a worst terminal return of +30.9%, while the median path still suffered a -76.6% peak-to-trough drawdown. Coinbase reproduced the same four-year 0/1,862 loss count.
The daily rolling results answer a narrow historical question: if a person bought at a Binance UTC daily open and sold exactly N dates later, how often was the net endpoint below the starting capital? They do not prove that the person could tolerate the path or remain invested.
The four-year rows overlap heavily and cover only the mature starts available between 2017 and 2022. Many rows describe nearly the same Bitcoin cycle. The correct wording is sample-specific, not 'Bitcoin has never lost money over four years everywhere.'
| Holding period | Complete starts | Losing starts | Median net return | Worst net return | Median max drawdown |
|---|---|---|---|---|---|
| 30d | 3,292 | 1540/3292 (46.8%) | +1.3% | -59.5% | -12.7% |
| 90d | 3,232 | 1501/3232 (46.4%) | +3.2% | -61.4% | -24.4% |
| 180d | 3,142 | 1343/3142 (42.7%) | +13.5% | -66.3% | -32.1% |
| 1y | 2,957 | 1046/2957 (35.4%) | +39.6% | -83.2% | -52.5% |
| 2y | 2,592 | 634/2592 (24.5%) | +105.7% | -65.0% | -63.3% |
| 4y | 1,862 | 0/1862 (0.0%) | +246.1% | +30.9% | -76.6% |
Where did the loss rate actually fall below 25%, 10% and zero?
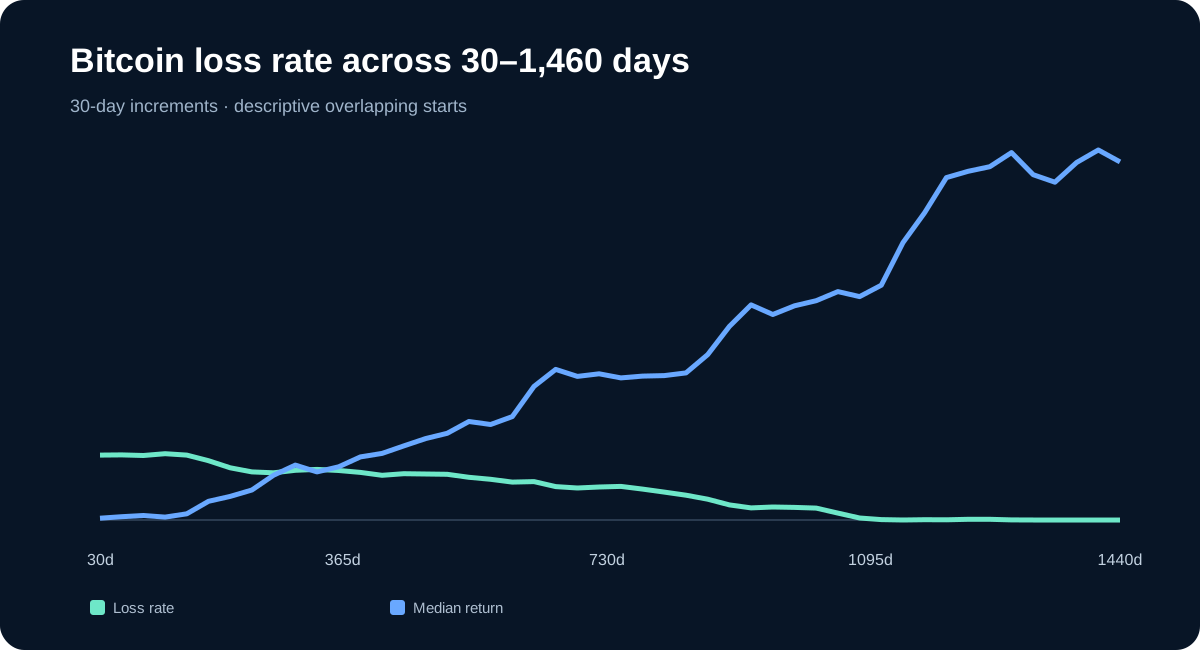
On the frozen Binance BTCUSDT 30-day holding grid, 660 days was the first point below a 25% historical terminal loss rate and 930 days the first below 10%. The first zero-loss point appeared at 1,140 days, but losing pockets returned at 1,170–1,290 days. Every tested grid point from 1,320 through 1,440 days, and the exact 1,460-day endpoint, was positive. This is a sample map, not a personal safe-holding deadline.
This non-monotonicity matters: adding 30 days did not always reduce risk. Each horizon drops the latest immature starts and changes the entry-date mix, while Bitcoin cycles are highly dependent. The line is a historical map, not a countdown to guaranteed profit.
| Milestone on 30-day grid | First horizon | Starts | Loss rate | Median return |
|---|---|---|---|---|
| Below 25% loss rate | 660 days | 2,662 | 24.0% | +108.5% |
| Below 10% loss rate | 930 days | 2,392 | 8.7% | +155.0% |
| First zero-loss point | 1,140 days | 2,182 | 0.0% | +199.8% |
| Continuous zero-loss grid begins | 1,320 days | 2,002 | 0.0% | +248.8% |
Did Bitcoin really have no losing four-year period?
In the frozen Binance BTCUSDT UTC daily-open history from August 17, 2017 through September 20, 2026, 0/1,862 complete 1,460-day starts ended negative after 0.15% entry and terminal-sale allowances. The worst net endpoint was +30.9% and median +246.1%. This is specific to the venue, definition and mature entry-date subset—not a promise that four years eliminates future Bitcoin risk.
That observation is narrower than the slogan. Binance BTCUSDT begins in August 2017, so mature four-year starts end no later than September 2026 and begin no later than September 2022. It does not contain every possible future monetary, regulatory, custody or market-structure regime.
More importantly, the median four-year path fell 76.6% from a prior sampled account peak before its endpoint. A positive terminal result does not mean the investor avoided severe losses, margin calls, emergencies or the temptation to exit.
| Statement | Supported? | Precise boundary |
|---|---|---|
| No negative terminal four-year row in this edition | Yes | 0/1,862 rolling Binance BTCUSDT starts |
| Four years guarantees profit | No | Future outcomes and other venues are unknown |
| Four-year holding avoids drawdowns | No | Median sampled max drawdown -76.6% |
| Rows are independent four-year cycles | No | Daily starts overlap almost completely |
What happens when overlapping starts are reduced?
Reducing overlapping Bitcoin entries leaves too few long-horizon cases for a universal rule. A greedy sensitivity takes the earliest eligible start and then waits a full horizon before accepting another. This reduces the illusion of thousands of independent tests, but it also leaves very small samples at long horizons.
Only two non-overlapping four-year anchors remain, and both were positive. That is consistent with the rolling table but far too small to establish a universal law. The two-year sensitivity contains four anchors, including one loss.
| Horizon | Non-overlapping starts | Losing starts | Median return | Worst return |
|---|---|---|---|---|
| 30d | 110 | 54/110 (49.1%) | +0.6% | -44.9% |
| 90d | 36 | 16/36 (44.4%) | +5.1% | -47.2% |
| 180d | 18 | 8/18 (44.4%) | +13.3% | -45.5% |
| 365d | 9 | 2/9 (22.2%) | +47.8% | -48.9% |
| 730d | 4 | 1/4 (25.0%) | +222.8% | -38.0% |
| 1460d | 2 | 0/2 (0.0%) | +575.0% | +151.1% |
Did buying near a high, in a drawdown or during fear change the answer?
Entry state changed the shorter-horizon Binance BTCUSDT distribution, but no sentiment slogan dominated every horizon. At one year, entries more than 40% below the trailing 365-day high had a +57.4% median and 17.5% loss rate; entries within 5% of the high had a +35.7% median and 37.8% loss rate. At four years, every price-position stratum was positive, but drawdowns remained large.
Fear & Greed groups are observational. Sentiment co-moves with price regime and only covers dates available in the frozen Alternative.me history; these rows do not isolate a causal effect of sentiment.
| Entry condition | Horizon | Starts | Median return | Loss rate | Median time underwater |
|---|---|---|---|---|---|
| Within 5% of 365d high | 1y | 473 | +35.7% | 179/473 (37.8%) | +28.7% |
| >40% below 365d high | 1y | 869 | +57.4% | 152/869 (17.5%) | +20.8% |
| Within 5% of 365d high | 2y | 335 | +48.1% | 120/335 (35.8%) | +11.1% |
| >40% below 365d high | 2y | 869 | +224.8% | 59/869 (6.8%) | +12.2% |
| Within 5% of 365d high | 4y | 172 | +225.4% | 0/172 (0.0%) | +15.2% |
| >40% below 365d high | 4y | 679 | +237.7% | 0/679 (0.0%) | +11.9% |
Did Coinbase show the same result?
Coinbase BTC-USD confirmed the headline endpoint counts when its 3,322 matched UTC daily-open dates were tested with the same horizons and 0.15% per-side allowances as Binance BTCUSDT. Both had 0/1,862 losing four-year endpoints; median returns differed only slightly. Agreement checks a venue-data artifact, not a second independent Bitcoin market cycle.
Cross-venue agreement reduces the chance that the headline is a Binance candle artifact. It does not add a second independent Bitcoin history: both venues observe the same underlying asset and global cycles.
| Horizon | Matched starts | Binance median | Coinbase median | Binance losses | Coinbase losses |
|---|---|---|---|---|---|
| 30d | 3,292 | +1.3% | +1.2% | 1540 | 1550 |
| 365d | 2,957 | +39.6% | +39.7% | 1046 | 1047 |
| 730d | 2,592 | +105.7% | +105.5% | 634 | 634 |
| 1460d | 1,862 | +246.1% | +245.2% | 0 | 0 |
How uncertain are the rolling percentages?
The historical Bitcoin percentages are highly cycle-dependent, not precise future loss odds. A moving-block bootstrap keeps contiguous date blocks together instead of treating adjacent starts as independent. The one-year median-return interval was -16.0% to +105.3%; its loss-rate interval was +14.4% to +60.8%. The width shows how strongly the result depends on which Bitcoin cycle dominates the resample.
For four years, every observed outcome was positive, so the block resamples also produce a zero loss-rate interval. That reflects the finite sample—it is not a probability statement that future four-year loss risk is zero.
| Horizon | Median-return 95% block interval | Loss-rate 95% block interval | Block size |
|---|---|---|---|
| 365d | -16.0% to +105.3% | +14.4% to +60.8% | 365 days |
| 730d | +5.0% to +285.8% | +5.6% to +47.7% | 365 days |
| 1460d | +160.8% to +409.3% | +0.0% to +0.0% | 365 days |
How quickly did Bitcoin first cover its entry and exit costs?
In this Binance BTCUSDT historical test, first break-even is only a daily-close touch above both 0.15% trading allowances, not permanent recovery or a sufficient holding-period choice. The observation ledger records the first completed daily close whose hypothetical sale value covered the entry and exit allowances. This is an early break-even touch, not permanent recovery: a position can cross above cost and later finish the horizon at a loss.
The median first touch is very short because Bitcoin frequently moves more than the 0.30% round-trip allowance within the first days. That statistic should not be confused with recovery from a deep bear-market drawdown or with the time needed to regain a personal purchase price after selling and re-entering.
For that reason, the core answer uses terminal loss rates and full-path drawdowns rather than advertising the first break-even touch as an investment benefit.
| Horizon | Touched break-even | Median first touch among those | Still ended negative |
|---|---|---|---|
| 30d | 2949/3292 (89.6%) | 0 day(s) | 1540/3292 (46.8%) |
| 90d | 3027/3232 (93.7%) | 1 day(s) | 1501/3232 (46.4%) |
| 180d | 2997/3142 (95.4%) | 1 day(s) | 1343/3142 (42.7%) |
| 365d | 2889/2957 (97.7%) | 1 day(s) | 1046/2957 (35.4%) |
| 730d | 2566/2592 (99.0%) | 1 day(s) | 634/2592 (24.5%) |
| 1460d | 1862/1862 (100.0%) | 1 day(s) | 0/1862 (0.0%) |
How should an investor choose a Bitcoin holding period?
Start with the date when the money may be needed, not the historical row with the highest median. A stated four-year horizon is not real if rent, debt, tax or emergency needs can force a sale during a large drawdown.
Position size should make the historical drawdown tolerable without leverage. If a 50–75% path decline would force liquidation or panic selling, a longer label on the plan does not solve the mismatch.
A schedule can reduce concentration in one entry date, but it creates a different experiment. The linked DCA studies compare deployment choices; this page isolates holding duration after a single purchase.
Verify: Bitcoin DCA versus lump sum · DCA plus buying the dip · BTC drawdown recovery
Data, exclusions and reproducibility
Version 2.0 uses 3,322 completed Binance BTCUSDT and 3,322 matched Coinbase BTC-USD UTC daily candles from 17 August 2017 through 20 September 2026. It publishes 17,077 path observations, a 48-point holding curve, entry-regime strata, block intervals and cross-venue summaries.
The public observation CSV contains every complete row used in the tables. The candidate CSV preserves pending or missing rows instead of turning them into zero returns. JSON includes the frozen contract, summaries and all observations. The standalone Python program rebuilds all three studies from the named frozen inputs.
Rolling observations overlap and share the same market cycles; counts are not independent trials. Historical percentages are descriptive, not probabilities for the next trade. The SHA-256 manifest protects this edition from accidental file changes; it does not remove selection, venue or execution limitations.
Verify: Complete study JSON · Observation CSV · Summary CSV · Candidate and missing ledger · Reproduction program · Preset protocol · File hashes
Take the next step with this evidence.
Choose ongoing Telegram monitoring or inspect structured data in your own research workflow.
Receive qualifying events in Telegram.
Use the ready-made alert checklist, message explanations and daily briefing. Check the supported categories and coins before subscribing; every Research page is not a separate alert category.
Check the alert list · View alert plans
Inspect the data before choosing a pack.
Prepared research packs supply scoped features, separate outcomes where available and quality flags. Buy a fixed edition once and download directly; API use is optional.
Check data pack samples · Explore the full data catalog · Compare data plans
Each purchased pack includes its specified fields and published date range. This page's full dataset is not automatically included. Other data families require coverage, date, field and source-use confirmation before purchase. Telegram Pro is a separate 30-day service; historical packs are one-time purchases.
Frequently asked questions
How long should you hold Bitcoin?
Historical loss risk fell materially with time, but the curve was not smooth and the path stayed severe. In 3,322 completed Binance BTCUSDT daily candles, 1046/2957 (35.4%) of one-year starts and 634/2592 (24.5%) of two-year starts still ended below the cost-adjusted entry. On the 30-day grid, the first horizon with a loss rate below 10% was 930 days; zero-loss points appeared later but were not monotonic until the mature long-horizon region. All 1,862 four-year starts ended positive, with a worst terminal return of +30.9%, while the median path still suffered a -76.6% peak-to-trough drawdown. Coinbase reproduced the same four-year 0/1,862 loss count.
Has Bitcoin ever lost money over four years?
Not in this specific matched Binance/Coinbase daily-open sample: both venues had 0/1,862 mature rolling four-year starts end negative after the preset costs. That is historical evidence, not a guarantee.
What was the worst four-year Bitcoin return?
The worst terminal return in this edition was still positive at +30.9%, but the median sampled maximum drawdown was -76.6%.
How often did Bitcoin lose money after one year?
1046/2957 (35.4%) of complete rolling one-year starts ended below the cost-adjusted starting capital.
How often did Bitcoin lose money after two years?
634/2592 (24.5%) of complete rolling two-year starts ended negative.
When did the historical loss rate fall below 10%?
On the 30-day grid, the first point below 10% was 930 days, with 209 losses among 2,392 starts. The curve was not monotonic.
Are the daily starts independent?
No. Adjacent windows share almost every price. The page reports non-overlapping anchors and moving-block intervals.
Does a positive four-year return mean low risk?
No. A path can finish positive after an extreme interim drawdown. Liquidity needs and leverage can prevent an investor from reaching the endpoint.
Are trading costs included?
Yes, 0.15% on entry and 0.15% on the terminal hypothetical sale. Tax, spread jumps, custody and opportunity cost are excluded.
Sources and verification
- Binance spot Kline documentationOfficial OHLCV field definitions; candles are not personal execution records.
- Coinbase Exchange candlesIndependent BTC-USD daily-open validation; the venue shares the same underlying Bitcoin cycles.
- Binance public-data documentationPublic historical-file and checksum documentation.
- Frozen CoinNudge evidence manifestHashes, byte sizes and edition scope.
Use the result as a decision check—not an automatic order.
Compare current market conditions and supported alerts before making your own decision.
Open Market Radar