Historical decision study · By CoinNudge Research · · Guide updated 2026-10-03 · 16 min read
Buy Bitcoin at an All-Time High—or Wait for a Pullback?
In this small, clustered sample, waiting for a deeper pullback improved the typical one-year result—but did not make buying a Bitcoin all-time high safe. Across 13 complete 30-day-cooled ATH episodes, next-open buying had a -16.0% median net one-year return and was positive in 4/13 (30.8%). Waiting up to 180 days for a 20% closing pullback produced a +5.9% median, was positive in 7/13 (53.8%), and beat immediate entry in 10/13 (76.9%). But only 9/13 actually reached the 20% threshold; the other four bought at the deadline. Events cluster in the 2020–2021 and 2024–2025 bull phases, so these percentages are descriptive—not reliable future odds.
Preview alert list · Explore research data · See alert plans
Buy Bitcoin at an all-time high: what are the waiting trade-offs?
- Immediate 1y median: -16.0%; positive in 4/13 (30.8%).
- Wait 20% / 180d median: +5.9%; threshold hit in 9/13 (69.2%).
- Deadline buys are separated from successful pullbacks; every policy shares the same exit date.
- Only 13 mature one-year episodes, clustered in two bull eras—not future odds.
What if Bitcoin never reaches the pullback you are waiting for?

A waiting policy is incomplete without a deadline. In the original 13 mature ATH episodes, waiting for a 20% closing decline within 180 days triggered nine times. The other four bought at the deadline’s next-open reference. They were not removed from the result, labelled perfect entries or left indefinitely in cash.
The complete nine-cell table below changes drawdown depth and deadline while keeping the same 13 episodes and one-year endpoint. Waiting for 20% for only 30 days triggered once; extending to 180 days triggered nine times. That improvement in trigger frequency is not proof that 180 days will be best in a new cycle, because rules were compared on the same small clustered history.
“Wait forever and never buy” would create a separate cash policy with its own missed-upside paths. This experiment does not report that policy as if it had been tested. The observed deadline branch is where the comparison accounts for the very real risk of not getting the hoped-for price.
| Closing pullback target | Maximum wait | Same episodes | Pullback reached | Deadline fallback | Median one-year net return |
|---|---|---|---|---|---|
| 5% | 30 days | 13 | 8 | 5 | -21.38% |
| 5% | 90 days | 13 | 10 | 3 | -23.96% |
| 5% | 180 days | 13 | 11 | 2 | -11.38% |
| 10% | 30 days | 13 | 4 | 9 | -21.38% |
| 10% | 90 days | 13 | 8 | 5 | -24.60% |
| 10% | 180 days | 13 | 11 | 2 | -2.58% |
| 20% | 30 days | 13 | 1 | 12 | -18.03% |
| 20% | 90 days | 13 | 4 | 9 | -11.31% |
| 20% | 180 days | 13 | 9 | 4 | +5.86% |
Which actual ATH cases bought at the deadline rather than the dip?
These are all four original 20%-within-180-days fallback events, not a sample selected because they favor waiting. Each row shows its actual reference entry and final account value from the same $10,000 budget. The disclosure makes opportunity cost visible rather than presenting only the nine successful dip triggers.
A cheaper average fill and a better final outcome are different quantities. Prices can still fall after buying the dip; immediate buying can win when a bull market accelerates. The staged policy also deploys fixed fractions at different prices and spends remaining cash at its deadline; its outcome cannot be reconstructed by averaging headline price discounts.
ATH here means a Binance daily close above all prior available Binance daily closes after the warmup, not an intraday wick, inflation-adjusted global peak or every exchange’s high. A close-known threshold cannot fill at that very close. The original next-open convention and cost sensitivity remain unchanged.
| Original ATH date UTC | Fallback wait days | Weighted reference purchase price | One-year ending $10,000 | Net return |
|---|---|---|---|---|
| 2020-11-24T00:00:00Z | 180 | $34,681.44 | $16,425.83 | +64.26% |
| 2020-12-25T00:00:00Z | 180 | $33,675.07 | $14,921.63 | +49.22% |
| 2024-11-06T00:00:00Z | 180 | $94,733.68 | $10,665.95 | +6.66% |
| 2025-05-18T00:00:00Z | 180 | $94,594.00 | $8,115.87 | -18.84% |
Verify: All 65 original main-policy event rows; nine-cell sensitivity is a separate original export
Should you buy all, split the order or set a pullback deadline?
Specify total exposure, required reserve and how long you can wait. For a pullback rule, name the reference high, completed-close threshold, deadline and fallback. For staged buying, define fractions and dates without adding leverage or extra capital whenever the first order loses.
The 13 episode count is exploratory and clustered in a few bull phases. A 76.9% retrospective beat-immediate fraction is not a future probability. A meaningful personal decision also depends on liquidity needs and acceptable drawdown, which no single ATH statistic can supply.
If the purpose is understanding trend confirmation rather than simply a price record, compare the separate moving-average study and its late-signal failures. They answer different questions and should not be merged into a newly optimized buying rule without a fresh protocol and a withheld test.
Buy Bitcoin at an all-time high—or wait?
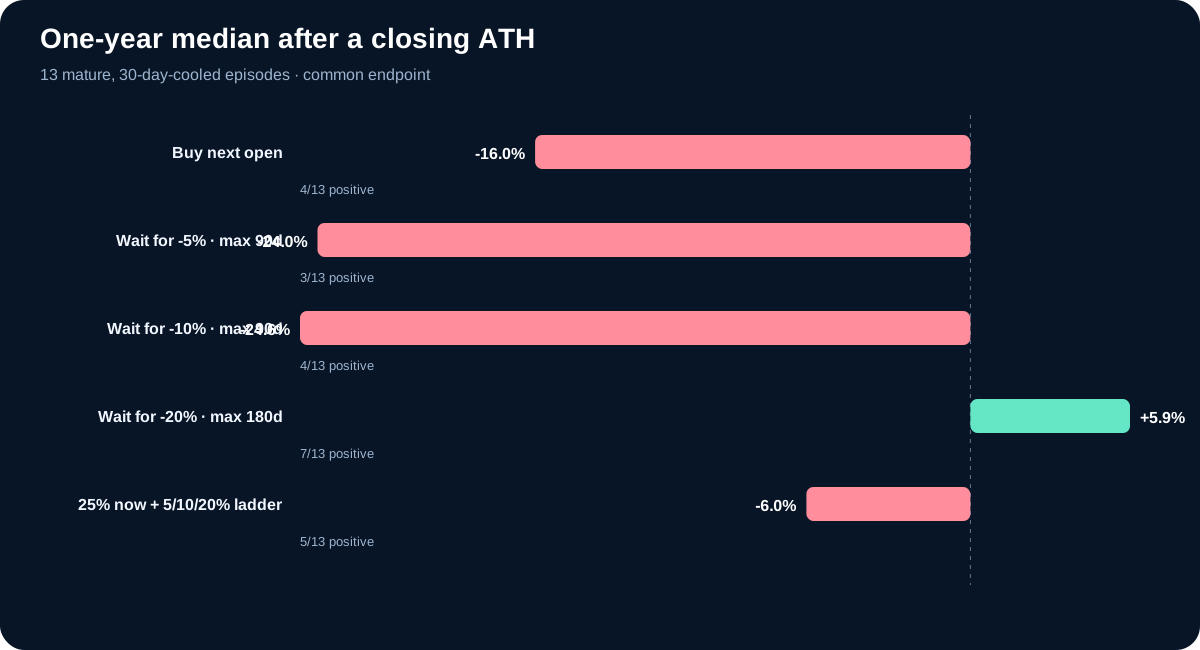
In the 13 complete, 30-day-cooled Binance BTCUSDT closing-ATH episodes, with a shared one-year endpoint and 0.15% per-side allowances, waiting did not make ATH buying safe. Immediate entry was not rewarded quickly in this event set: the median one-year result was -16.0% and the median sampled account drawdown was -53.0%. The best median among the preset primary policies was the 20%-within-180-days rule at +5.9% with a -35.1% median drawdown.
A shallow discount was not enough. Waiting up to 90 days for 5% had a -24.0% median and only 3/13 positive outcomes. Waiting for 10% had a -24.6% median. Buying a little lower can still lose if the subsequent year is weak.
The four-tranche ladder split capital between immediate, -5%, -10% and -20% entries, then deployed any remainder after 180 days. Its median was -6.0% and it beat immediate buying in 10/13 (76.9%). That is a compromise in this sample, not a universal recommendation.
| Policy | Complete 1y episodes | Median net | Positive | Threshold fully hit | Beat immediate | Median max drawdown |
|---|---|---|---|---|---|---|
| Buy next open | 13 | -16.0% | 4/13 (30.8%) | — | 0/13 (0.0%) | -53.0% |
| Wait for -5% · max 90d | 13 | -24.0% | 3/13 (23.1%) | 10/13 (76.9%) | 10/13 (76.9%) | -50.5% |
| Wait for -10% · max 90d | 13 | -24.6% | 4/13 (30.8%) | 8/13 (61.5%) | 8/13 (61.5%) | -49.4% |
| Wait for -20% · max 180d | 13 | +5.9% | 7/13 (53.8%) | 9/13 (69.2%) | 10/13 (76.9%) | -35.1% |
| 25% now + 5/10/20% ladder | 13 | -6.0% | 5/13 (38.5%) | 9/13 (69.2%) | 10/13 (76.9%) | -46.6% |
What counts as a Bitcoin all-time high in this study?
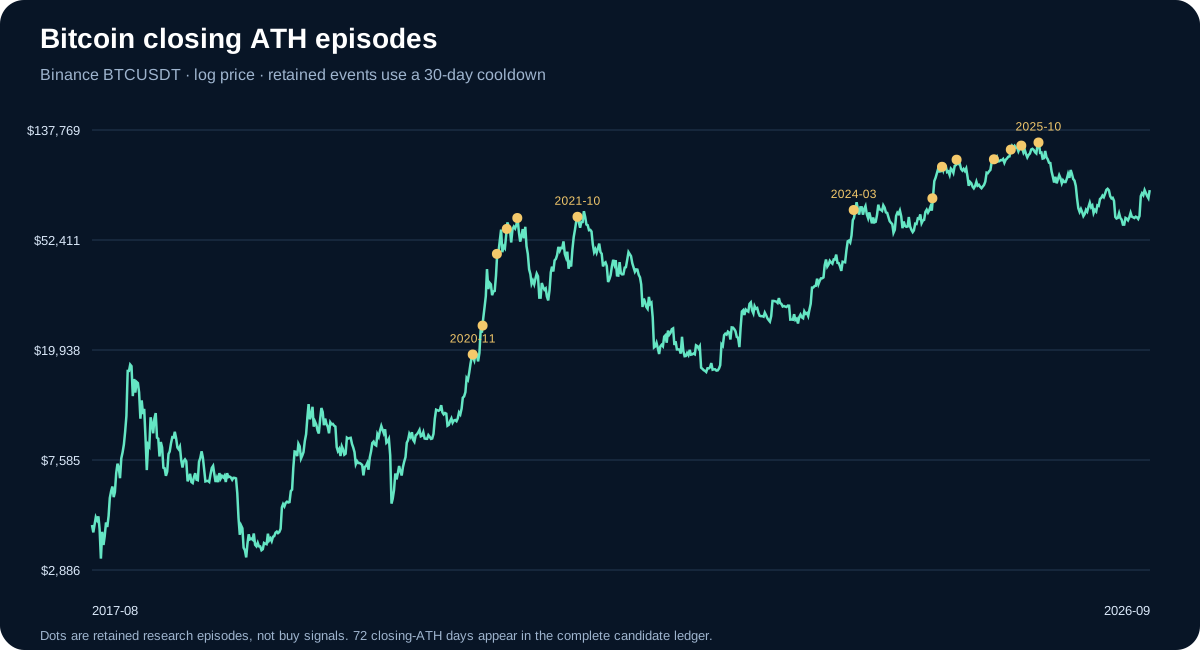
An event day must close strictly above every earlier Binance BTCUSDT UTC daily close, after at least 365 complete prior daily bars. This is a venue-observed closing ATH—not an intraday wick, rolling 24-hour ticker high or claim about every global Bitcoin venue.
The raw scan found 72 closing-ATH candidate days. A greedy 30-day cooldown retained 14; 13 now have a complete one-year outcome and one remains pending. The 7-day sensitivity retains 24 episodes and the 60-day version 10; the headline does not silently choose the cooldown with the best return.
The signal exists only after the ATH day closes. Immediate purchase therefore uses the next UTC daily open. A pullback exists only after a later daily close reaches its threshold, followed by purchase at the next open. Intraday lows do not create assumed fills.
| Rule | Frozen definition |
|---|---|
| ATH | Close > every prior Binance BTCUSDT daily close; ≥365 prior bars |
| Main episode | First eligible ATH, then suppress retained events for 30 UTC days |
| Immediate entry | Next UTC daily open after ATH close |
| Pullback trigger | Later daily close ≤ ATH close × (1 − threshold) |
| Unfilled by deadline | Buy at deadline + 1 UTC open; label as deadline, not trigger |
| Terminal comparison | Same ATH+366/731/1461-day open for every policy |
How deep a pullback, and how long should the rule wait?
The 5%, 10% and 20% rows below were calculated at 30-, 90- and 180-day deadlines before reading outcomes. Every rule eventually buys, so the result answers “wait, but not forever.” It is different from holding cash indefinitely until an order fills.
Deeper thresholds require more patience and fail to trigger more often at short deadlines. For example, only 1/13 episodes reached a 20% closing pullback within 30 days, compared with 9/13 within 180 days. A deadline purchase can occur above or below the original next-open price; it must not be counted as a successful dip fill.
The 20%/180-day cell had the highest median among this preset grid, but the grid contains nine comparisons on only 13 mature events. Treat it as a transparent sensitivity surface—not an optimized production rule.
| Pullback / deadline | Threshold hit | Median wait | Median 1y net | Positive | Beat immediate | Median excess vs immediate |
|---|---|---|---|---|---|---|
| 5% / 30d | 8/13 (61.5%) | 11d | -21.4% | 4/13 (30.8%) | 9/13 (69.2%) | +3.4% |
| 5% / 90d | 10/13 (76.9%) | 11d | -24.0% | 3/13 (23.1%) | 10/13 (76.9%) | +3.8% |
| 5% / 180d | 11/13 (84.6%) | 11d | -11.4% | 5/13 (38.5%) | 11/13 (84.6%) | +3.9% |
| 10% / 30d | 4/13 (30.8%) | 30d | -21.4% | 4/13 (30.8%) | 9/13 (69.2%) | +2.1% |
| 10% / 90d | 8/13 (61.5%) | 66d | -24.6% | 4/13 (30.8%) | 8/13 (61.5%) | +6.8% |
| 10% / 180d | 11/13 (84.6%) | 66d | -2.6% | 6/13 (46.2%) | 11/13 (84.6%) | +8.5% |
| 20% / 30d | 1/13 (7.7%) | 30d | -18.0% | 4/13 (30.8%) | 7/13 (53.8%) | +1.2% |
| 20% / 90d | 4/13 (30.8%) | 90d | -11.3% | 4/13 (30.8%) | 7/13 (53.8%) | +0.9% |
| 20% / 180d | 9/13 (69.2%) | 100d | +5.9% | 7/13 (53.8%) | 10/13 (76.9%) | +14.2% |
Which historical ATH episodes are actually in the result?
The table lists every retained 30-day-cooled Binance BTCUSDT closing-ATH episode after the 365-bar warmup, including pending status. Multiple 2020–2021 and 2024–2025 episodes share broad cycles and holding windows; a cooldown reduces nearby duplicates but does not turn the 13 complete one-year observations into independent market regimes.
One-year results are mature through the August 2025 episode. The October 2025 event is pending and remains in the ledger rather than receiving a partial result. Two- and four-year tables use still smaller mature subsets.
| Closing ATH date | Signal close | 1y | 2y | 4y |
|---|---|---|---|---|
| 2020-11-24 | $19,160.01 | complete | complete | complete |
| 2020-12-25 | $24,712.47 | complete | complete | complete |
| 2021-02-08 | $46,374.87 | complete | complete | complete |
| 2021-03-11 | $57,773.16 | complete | complete | complete |
| 2021-04-13 | $63,575.00 | complete | complete | complete |
| 2021-10-19 | $64,280.59 | complete | complete | complete |
| 2024-03-04 | $68,245.71 | complete | complete | pending |
| 2024-11-06 | $75,571.99 | complete | pending | pending |
| 2024-12-06 | $99,740.84 | complete | pending | pending |
| 2025-01-21 | $106,143.82 | complete | pending | pending |
| 2025-05-18 | $106,454.26 | complete | pending | pending |
| 2025-07-10 | $116,010.00 | complete | pending | pending |
| 2025-08-12 | $120,134.08 | complete | pending | pending |
| 2025-10-05 | $123,482.31 | pending | pending | pending |
Why did waiting help in many episodes but still lose money?
The 10%/90-day policy bought at a median 10.5% below the immediate next-open price and beat immediate entry in 8/13 (61.5%). Yet its median one-year account result was -24.6%. Relative improvement is not the same as an absolute profit.
The 20%/180-day policy waited a median 100 days and acquired at a median 20.8% discount to immediate entry. Cash avoided part of some drawdowns, but a long deadline also created opportunity cost in episodes that kept rising.
A person asking “should I wait for a pullback?” is choosing between price risk and time-in-cash risk. The experiment measures both through a common terminal date. It does not assume the waiting policy gets an extra 180 days after entering.
What happened after two and four years?
The horizon changed the historical answer, but the mature cohorts also changed: only 7 retained Binance BTCUSDT closing-ATH episodes have complete two-year endpoints, versus 6 with four-year endpoints. Immediate entry had a -50.6% two-year median and 1/7 (14.3%) positive outcomes, concentrated around 2020–2021 entries. Comparing these with the four-year subset is not a causal test of extending every investor’s holding period.
Only 6 have mature four-year outcomes. All were positive, with a +86.9% immediate-entry median. That does not erase severe interim drawdowns or prove every future four-year holding period will recover.
The horizon reversal is the useful conclusion: “ATH is dangerous” and “Bitcoin eventually recovered” can both describe this sample at different dates. Your actual need for cash and ability to tolerate drawdown determine whether a long horizon is real or merely stated.
| Horizon / policy | Mature n | Median net | Positive | Beat immediate | Median max drawdown |
|---|---|---|---|---|---|
| 1y · Buy next open | 13 | -16.0% | 4/13 (30.8%) | 0/13 (0.0%) | -53.0% |
| 1y · Wait for -10% · max 90d | 13 | -24.6% | 4/13 (30.8%) | 8/13 (61.5%) | -49.4% |
| 1y · Wait for -20% · max 180d | 13 | +5.9% | 7/13 (53.8%) | 10/13 (76.9%) | -35.1% |
| 1y · 25% now + 5/10/20% ladder | 13 | -6.0% | 5/13 (38.5%) | 10/13 (76.9%) | -46.6% |
| 2y · Buy next open | 7 | -50.6% | 1/7 (14.3%) | 0/7 (0.0%) | -76.6% |
| 2y · Wait for -10% · max 90d | 7 | -49.7% | 1/7 (14.3%) | 5/7 (71.4%) | -76.6% |
| 2y · Wait for -20% · max 180d | 7 | -41.8% | 1/7 (14.3%) | 5/7 (71.4%) | -76.6% |
| 2y · 25% now + 5/10/20% ladder | 7 | -45.6% | 1/7 (14.3%) | 5/7 (71.4%) | -76.6% |
| 4y · Buy next open | 6 | +86.9% | 6/6 (100.0%) | 0/6 (0.0%) | -76.6% |
| 4y · Wait for -10% · max 90d | 6 | +76.5% | 6/6 (100.0%) | 4/6 (66.7%) | -76.6% |
| 4y · Wait for -20% · max 180d | 6 | +139.9% | 6/6 (100.0%) | 4/6 (66.7%) | -76.6% |
| 4y · 25% now + 5/10/20% ladder | 6 | +112.6% | 6/6 (100.0%) | 4/6 (66.7%) | -76.6% |
Are the results after trading costs?
Yes: this Binance BTCUSDT closing-ATH experiment deducts 0.15% of executed notional on each purchase and the common terminal sale, including the 13 complete one-year episodes. The public ledger repeats identical episodes at 0.05% and 0.30% per side. Tranches incur proportional charges on each purchase, not an assumed fixed ticket fee.
Real execution can differ because of spread, tax, order minimums, slippage during volatile opens and unavailable venue access. Cash earns zero here. Adding cash yield would improve waiting policies; adding tax and spread could reduce them. Neither is silently assumed.
How do you turn a Bitcoin ATH into a decision plan rather than a price forecast?
Treat a Bitcoin ATH as a price record, then define an exposure budget, holding horizon and fallback—not a forecast that price must fall. First separate the questions. “Is Bitcoin at an ATH?” is factual. “Can it keep rising?” requires current trend, demand and leverage evidence. “Should I buy?” additionally requires your horizon, liquidity needs, loss tolerance and existing exposure.
If immediate regret is the main risk, a predefined schedule can reduce timing concentration. If missed upside is the main risk, keeping a starter tranche while defining pullback levels makes that trade-off explicit. Do not move thresholds after every price change and then call the outcome a tested strategy.
Before using any historical row, check current market breadth, spot demand, funding, open interest and whether leverage—not conviction—is driving the move. No current condition makes the 13 historical episodes a personalized probability.
Verify: Current market radar · Bitcoin breakout confirmation study · Bitcoin DCA vs lump sum
Data, exclusions and reproducibility
The input contains 3,322 completed BTCUSDT daily candles from 2017-08-17 through 2026-09-20. The complete ledger contains 72 closing-ATH days after the 365-day warmup; 14 are retained by the 30-day rule.
Thirteen retained events have complete one-year endpoints, seven have two-year endpoints and six have four-year endpoints. Every primary policy is repeated at three cost levels, producing 390 published account rows. Pending events are not assigned zero returns.
The JSON publishes each event’s exact execution schedule—including whether a purchase followed a qualifying pullback or a deadline. CSV files expose all outcomes and the 3×3 wait matrix. Inputs, source URLs, standalone code, protocol and file hashes make the edition reproducible.
| Evidence file | What it contains |
|---|---|
| ath.json | Rules, event ledger, all observations, summaries and wait matrix |
| ath-observations.csv | Event × horizon × policy × cost account results |
| ath-candidates.csv | All closing ATH candidates and cooldown status |
| ath-wait-matrix.csv | Preset 5/10/20% × 30/90/180-day comparison |
| inputs.json.gz | Frozen completed BTC daily bars and source requests |
| study-code.py + protocol.md | Standalone calculation and rules frozen before results |
Take the next step with this evidence.
Choose ongoing Telegram monitoring or inspect structured data in your own research workflow.
Receive qualifying events in Telegram.
Use the ready-made alert checklist, message explanations and daily briefing. Check the supported categories and coins before subscribing; every Research page is not a separate alert category.
Check the alert list · View alert plans
Inspect the data before choosing a pack.
Prepared research packs supply scoped features, separate outcomes where available and quality flags. Buy a fixed edition once and download directly; API use is optional.
Check data pack samples · Explore the full data catalog · Compare data plans
Each purchased pack includes its specified fields and published date range. This page's full dataset is not automatically included. Other data families require coverage, date, field and source-use confirmation before purchase. Telegram Pro is a separate 30-day service; historical packs are one-time purchases.
Frequently asked questions
Is it bad to buy Bitcoin at an all-time high?
Not automatically, but the next year was difficult in this small event sample: immediate entry had a -16.0% median and 4/13 (30.8%) positive outcomes. Four-year mature episodes were all positive, showing that horizon changes the answer.
Should I wait for a 10% Bitcoin pullback?
The 10%/90-day rule beat immediate entry in 8/13 (61.5%) but still had a -24.6% median one-year return. A cheaper entry did not guarantee profit.
Was a 20% pullback better?
The preset 20%/180-day rule had the best primary median, +5.9%, and beat immediate entry in 10/13 (76.9%). Only 9/13 hit the threshold; four bought at the deadline. The sample is small and clustered.
What if Bitcoin never pulls back?
Every wait rule has a fixed deadline. If the closing threshold is not reached, the model buys at the following UTC open and labels it a deadline purchase. It is not counted as a successful pullback fill.
Is your ATH an intraday high?
No. It is a Binance BTCUSDT UTC daily close strictly above every earlier daily close after 365 prior complete bars. Intraday wicks and other venues are outside the definition.
Are 13 events enough?
They are enough to show the exact historical paths, but not enough for a stable universal probability. Events cluster within two bull-market eras and overlap. The page therefore publishes counts, dates and sensitivity instead of claiming a dependable edge.
Are fees included?
Yes: 0.15% per buy or sell in the headline, with 0.05% and 0.30% rows in the evidence. Tax, financing, cash yield and market impact are not included.
Can I download every ATH observation?
Yes. The candidate ledger, event-level account outcomes, wait matrix, frozen BTC candles, code, protocol and SHA-256 manifest are public.
Are the ATH cases independent investment opportunities?
No. The small 13-event one-year cohort clusters in a few market regimes and has overlapping holding windows. Percentages are descriptive.
Sources and verification
- Binance spot Kline documentationOfficial UTC daily OHLC fields; venue history is not a global price index.
- Binance public-data documentationTimestamp and historical-data provenance context.
- Public question: buy BTC now or wait for a pullbackDemand context only; not evidence for a policy.
- Frozen evidence manifestFile hashes, sizes and acquisition edition.
- October 2 explanatory evidence editionOriginal experiments preserved; normalized accounting, snapshots and new-study input hashes.
- October 2 readable chart editionChart file hashes and bindings to unchanged frozen numerical evidence.
- Independent October 2 arithmetic auditSeparate arithmetic, checksums and replay diagnostics; not certification of future results.
Do not turn one historical percentage into an automatic trade.
Check the live market context and supported alerts before making your own decision.
Explore current market context