Historical decision study · By CoinNudge Research · · Guide updated 2026-10-03 · 16 min read
Does Buying Fear and Selling Greed Work for Bitcoin?
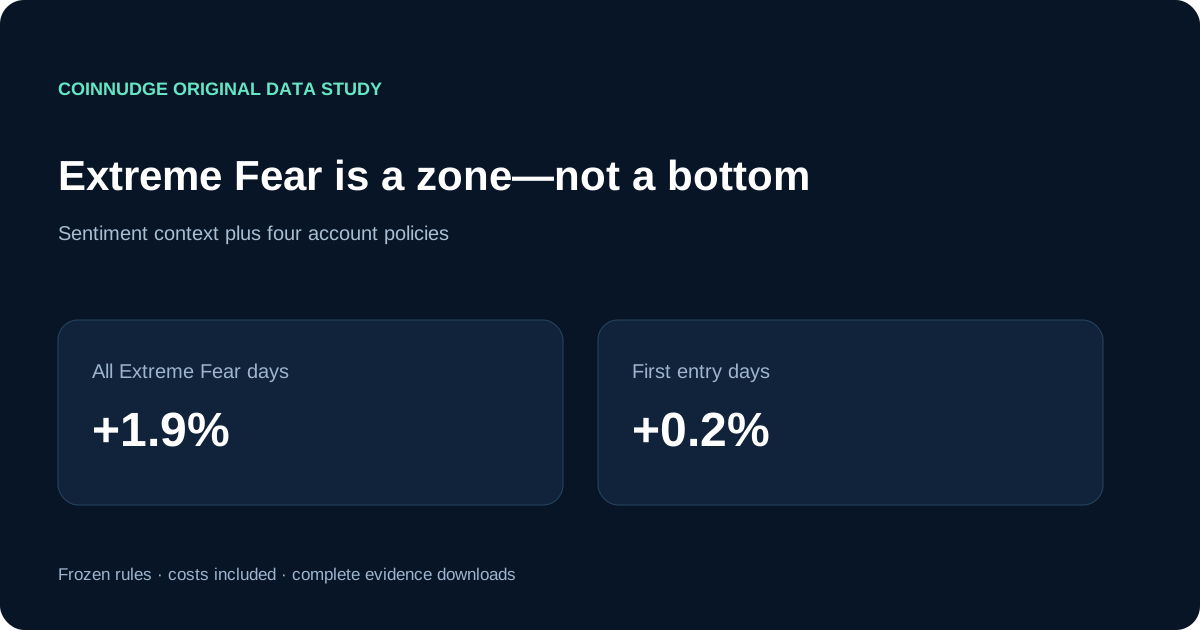
Extreme Fear is better treated as a zone to start paying attention and consider staged buying—not proof that Bitcoin has bottomed or a signal to go all in. Across 679 complete Extreme Fear days, Bitcoin’s next-30-day median return was +1.9% and 400/679 (58.9%) were positive; but on the 109 first days entering Extreme Fear, the median was only +0.2% and the positive share was 55/109 (50.5%). Extreme Greed is likewise a prompt to review risk and concentration—not a mandatory full exit. The complete all-in Extreme Fear / all-out Extreme Greed rule had a +0.0% median one-year return and beat buy-and-hold in only 24/92 (26.1%). These are overlapping historical observations, not future probabilities.
Preview alert list · Explore research data · See alert plans
Key points
- Extreme Fear is a review and possible staged-entry zone—not proof of a bottom or an all-in signal.
- All Extreme Fear days: +1.9% median next 30d; first-entry days: +0.2%.
- Extreme switching median: +0.0%; it beat holding in 24/92 (26.1%).
- Extreme Greed is a risk-review prompt, not a mandatory full exit.
Does the Fear & Greed Index identify a Bitcoin bottom or top?
The Bitcoin Fear & Greed Index is a context zone, not an exact bottom or top signal. In this frozen Alternative.me/Binance BTCUSDT study, the 109 first days entering Extreme Fear had only a +0.2% next-30-day median and 55/109 (50.5%) positive outcomes, despite a positive median across all 679 Extreme Fear days. Daily readings within a panic episode are not independent opportunities.
Extreme Greed does not identify a dependable top either. Across all 330 complete Extreme Greed days, the next-30-day median was still +3.8% and 185/330 (56.1%) were positive. On first entry into Extreme Greed, the median was -1.8%; that weaker transition result is a reason to review risk, not proof that an immediate full sale is optimal.
The practical reading is asymmetric: use Extreme Fear to begin a valuation, liquidity and staged-entry review; use Extreme Greed to review concentration, leverage and planned exits. Neither label replaces position sizing, a time horizon or current market evidence.
| Sentiment observation | Complete 30d n | Median next 30d | Positive next 30d |
|---|---|---|---|
| All Extreme Fear days | 679 | +1.9% | 400/679 (58.9%) |
| First day entering Extreme Fear | 109 | +0.2% | 55/109 (50.5%) |
| All Extreme Greed days | 330 | +3.8% | 185/330 (56.1%) |
| First day entering Extreme Greed | 59 | -1.8% | 27/59 (45.8%) |
Verify: Current Fear & Greed context
Does buying fear and selling greed work? The direct result
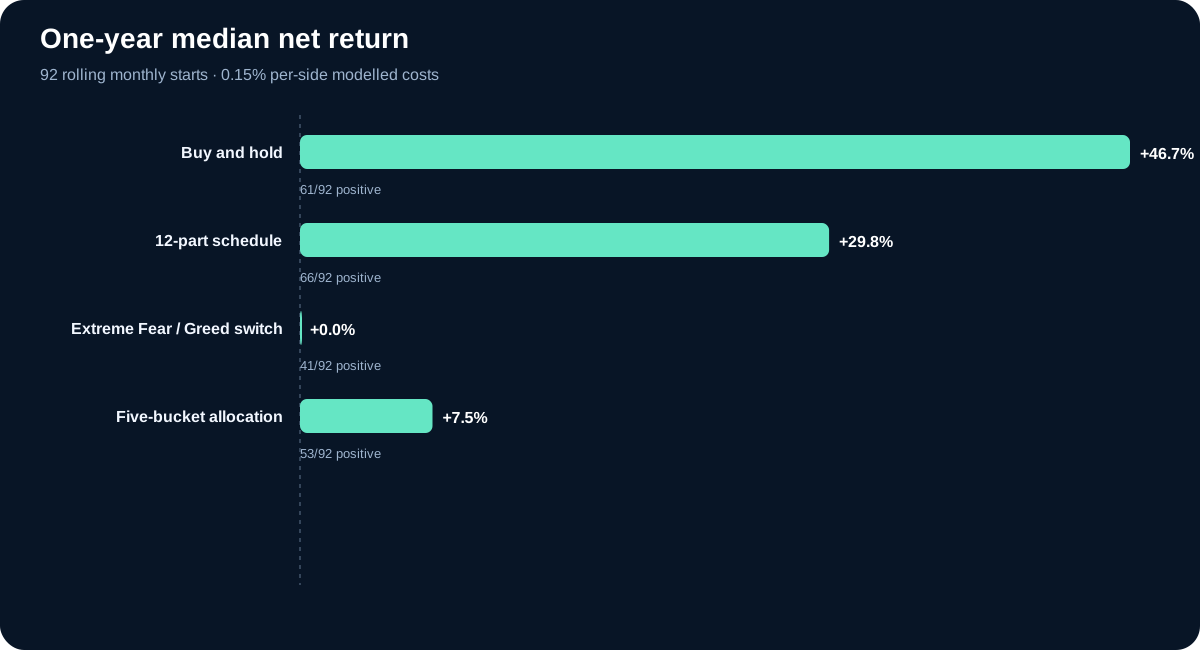
No dependable all-in/all-out advantage appeared in the 92 complete one-year monthly BTCUSDT starts: Extreme Fear buy / Extreme Greed sell had a +0.0% median net return and beat buy-and-hold in 24/92 (26.1%), using the same $10,000 budget, common endpoint and 0.15% per-side allowances. This account result differs from a sentiment bucket’s forward price change. The worst switch cohort lost -65.7%, so zero median is not zero risk.
The five-bucket rule also lagged. It moved between 100%, 75%, 50%, 25% and 0% BTC as sentiment crossed fixed boundaries. Its median return was +7.5% and it beat holding in 32/92 (34.8%). Frequent boundary crossings produced a median 23.8× starting-capital turnover and $366 of modelled costs.
The comparison starts every policy with the same $10,000 and ends every policy on the same UTC open. Cash observations remain in the result. That prevents an uninvested strategy from being reported only when it happened to enter.
| Strategy | Complete 1y starts | Median net return | Positive | Beat buy & hold | Median max drawdown | Median costs |
|---|---|---|---|---|---|---|
| Buy and hold | 92 | +46.7% | 61/92 (66.3%) | 0/92 (0.0%) | -50.0% | $37 |
| 12-part schedule | 92 | +29.8% | 66/92 (71.7%) | 36/92 (39.1%) | -30.4% | $34 |
| Extreme Fear / Greed switch | 92 | +0.0% | 41/92 (44.6%) | 24/92 (26.1%) | -39.5% | $34 |
| Five-bucket allocation | 92 | +7.5% | 53/92 (57.6%) | 32/92 (34.8%) | -38.3% | $366 |
What exactly did CoinNudge test?
Alternative.me publishes one daily Crypto Fear & Greed value. We preserved its reported classification, but the experiment uses fixed numeric buckets: 0–24 Extreme Fear, 25–44 Fear, 45–55 Neutral, 56–74 Greed and 75–100 Extreme Greed. A reading becomes usable only after its UTC date is known; any portfolio change occurs at the following Binance BTCUSDT daily open.
Buy-and-hold invests the whole account once. The 12-part schedule deploys equal cash portions 30 days apart. The extreme switch buys all BTC when the index enters Extreme Fear and sells all when it enters Extreme Greed. The five-bucket strategy rebalances only when the bucket changes. We did not search alternative thresholds after seeing returns.
A proportional 0.15% allowance is charged to every buy and sell. The terminal valuation deducts a hypothetical exit cost so that cash and BTC policies share a realizable comparison. It does not represent a guaranteed exchange fill or an instruction to close.
| Index range | Analysis bucket | Five-bucket BTC target | Extreme switch action |
|---|---|---|---|
| 0–24 | Extreme Fear | 100% | Buy all if in cash |
| 25–44 | Fear | 75% | Hold prior state |
| 45–55 | Neutral | 50% | Hold prior state |
| 56–74 | Greed | 25% | Hold prior state |
| 75–100 | Extreme Greed | 0% | Sell all if invested |
Verify: Alternative.me index and attribution · Binance daily Kline field definitions
What happened to one $10,000 account across the available shared history?
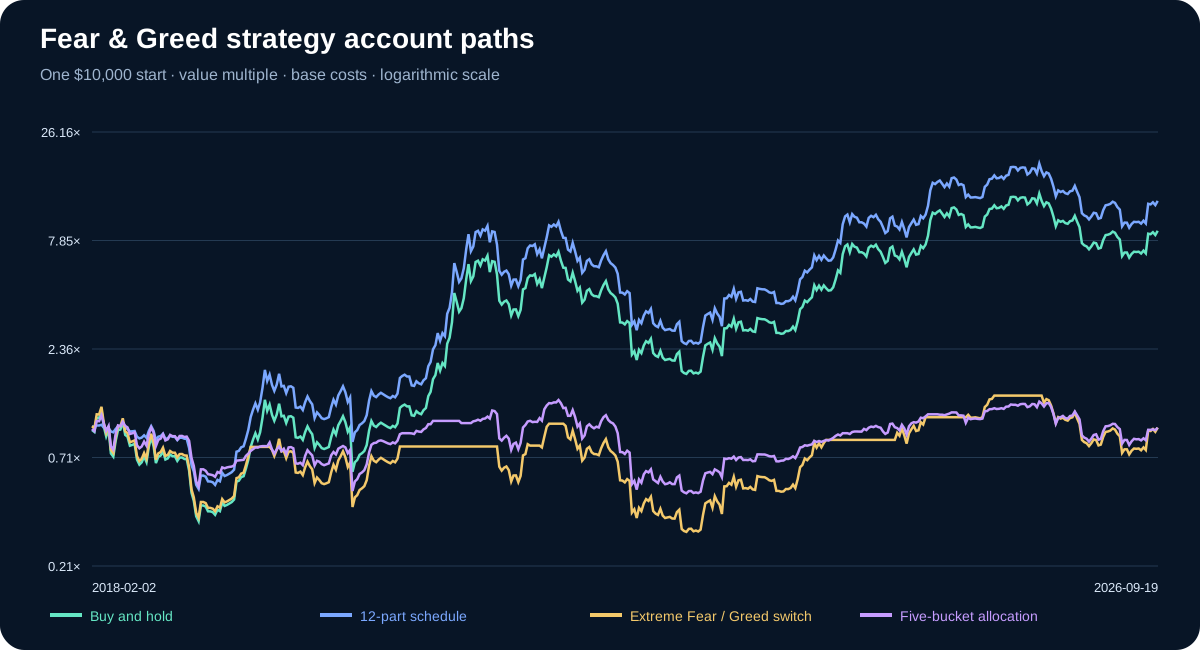
The earliest aligned sentiment date is 2018-02-01; the frozen account path ends at the 2026-09-20 UTC open. On this one start, buy-and-hold finished +778.2% above starting capital and the 12-part schedule +1123.4%. The extreme switch finished -1.1% and the five-bucket allocation -1.6%.
That path began near a major 2018 drawdown, which favoured spreading purchases. It is useful for understanding account mechanics, not for claiming the scheduled plan always wins. The rolling cohorts below deliberately move the start date to show how dependent the answer is on when the investor began.
The vertical scale is account value divided by $10,000 and is logarithmic. Lines include cash, BTC marks and an estimated liquidation cost at every daily mark; they are not raw Bitcoin-price lines.
Does the answer change over two or four years?
The sentiment switch did not catch up with holding in the longer mature cohorts: at two years (80 monthly starts), buy-and-hold’s median was +103.0% versus +6.7% for the extreme switch. At four years (56 starts), every holding outcome was positive, its median was +218.8%, the switch median was +12.8%, and the switch beat holding in 0/56. These different overlapping cohorts are not independent trials or the same 92 one-year starts extended.
The 12-part schedule was different: its four-year median was +236.8% and it beat immediate holding in 30/56 (53.6%). That does not prove DCA is superior; these start dates include the same historical cycle many times and the staged capital was especially helpful near falling markets.
Longer horizons have fewer mature starts and more overlap. The 56 four-year rows are not 56 independent Bitcoin cycles.
| Horizon / strategy | Complete n | Median net | Positive | Beat buy & hold | Median max drawdown |
|---|---|---|---|---|---|
| 1y · Buy and hold | 92 | +46.7% | 61/92 (66.3%) | 0/92 (0.0%) | -50.0% |
| 1y · 12-part schedule | 92 | +29.8% | 66/92 (71.7%) | 36/92 (39.1%) | -30.4% |
| 1y · Extreme Fear / Greed switch | 92 | +0.0% | 41/92 (44.6%) | 24/92 (26.1%) | -39.5% |
| 1y · Five-bucket allocation | 92 | +7.5% | 53/92 (57.6%) | 32/92 (34.8%) | -38.3% |
| 2y · Buy and hold | 80 | +103.0% | 60/80 (75.0%) | 0/80 (0.0%) | -61.0% |
| 2y · 12-part schedule | 80 | +115.9% | 60/80 (75.0%) | 30/80 (37.5%) | -53.1% |
| 2y · Extreme Fear / Greed switch | 80 | +6.7% | 46/80 (57.5%) | 10/80 (12.5%) | -60.0% |
| 2y · Five-bucket allocation | 80 | +9.2% | 44/80 (55.0%) | 8/80 (10.0%) | -49.8% |
| 4y · Buy and hold | 56 | +218.8% | 56/56 (100.0%) | 0/56 (0.0%) | -76.6% |
| 4y · 12-part schedule | 56 | +236.8% | 56/56 (100.0%) | 30/56 (53.6%) | -74.1% |
| 4y · Extreme Fear / Greed switch | 56 | +12.8% | 37/56 (66.1%) | 0/56 (0.0%) | -72.7% |
| 4y · Five-bucket allocation | 56 | +4.6% | 31/56 (55.4%) | 0/56 (0.0%) | -66.2% |
Why can selling greed underperform?
Greed can describe a mature top, but it can also persist during a powerful trend. An all-out sale removes both downside and subsequent upside. The rule then requires a later Extreme Fear entry; if price stays elevated while sentiment cools only to Neutral or Fear, cash can remain uninvested.
The index also mixes volatility, momentum, social and other components. It is not an independent valuation measure. BTC price momentum can therefore influence both the signal and the outcome being measured. This study evaluates the rule as users commonly describe it; it does not interpret correlation as causation.
Threshold crossings create path dependence. Moving from 24 to 25 changes the five-bucket target by 25 percentage points even though the index moved one point. That is why the published trade count, turnover and costs matter as much as the headline return.
Do fees change the conclusion?
Frequent sentiment rebalancing incurred higher costs, but lower fees alone do not solve mistimed cash exposure. At the 0.15% per-side base across 92 one-year cohorts, median costs were $37 for holding versus $366 for five-bucket allocation. The public ledger repeats fixed cohorts and entry dates at 0.05%, 0.15% and 0.30% to isolate cost sensitivity. Taxes and spread spikes remain omitted.
The five-bucket strategy’s median turnover was 23.8 times starting capital. A lower advertised fee does not erase spread, tax or operational burden.
| Strategy | Median 1y trades | Median turnover / initial capital | Median modelled costs |
|---|---|---|---|
| Buy and hold | 1 | 1.00× | $37 |
| 12-part schedule | 12 | 1.00× | $34 |
| Extreme Fear / Greed switch | 2 | 2.05× | $34 |
| Five-bucket allocation | 83 | 23.77× | $366 |
How should an investor use Fear & Greed after this result?
Use it as a context variable, not a complete order. A fear reading can prompt questions about position size, time horizon and whether leverage is forcing a decision. A greed reading can prompt a review of concentration, planned rebalancing and liquidity needs. Neither reading identifies intrinsic value or guarantees a reversal.
If you want staged exposure, define the contribution schedule and maximum allocation before the next reading. If you want a sentiment overlay, test how much it changes an existing diversified plan rather than allowing a one-point bucket crossing to move the entire account.
For a current decision, combine the live sentiment value with market breadth, spot demand, derivatives positioning and your own cash constraints. Those checks can explain context; they still cannot turn a historical median into personal advice.
Verify: Current Fear & Greed forward-return study · Current market breadth and context
Data, sample construction and reproducibility
The frozen inputs contain 3,151 Alternative.me source days and 3,322 completed Binance BTCUSDT daily candles. The shared experiment begins on 2018-02-01. The one-year result contains 92 monthly first-observation starts; two-year and four-year results contain 80 and 56.
Every candidate start remains in fear-greed-candidates.csv with complete or pending status. Every strategy, horizon and cost row is in fear-greed-observations.csv. The JSON adds the full-history daily chart path. Inputs, code, protocol and SHA-256 hashes are downloadable; no production alert record is used as a backfilled sentiment value.
This is retrospectively retrieved source history, not proof that CoinNudge recorded every reading live on its publication day. Binance BTCUSDT venue history is not a global Bitcoin index. Monthly cohorts overlap, classification definitions can change, and cash earns zero in this model.
| Evidence file | What it contains |
|---|---|
| fear-greed.json | Complete summary, observations, candidates and chart path |
| fear-greed-observations.csv | All strategy × horizon × cost account outcomes |
| fear-greed-candidates.csv | Complete and pending monthly starts |
| inputs.json.gz | Frozen BTC candles, sentiment rows and acquisition URLs |
| study-code.py + protocol.md | Calculation logic and rules fixed before results |
Take the next step with this evidence.
Choose ongoing Telegram monitoring or inspect structured data in your own research workflow.
Receive qualifying events in Telegram.
Use the ready-made alert checklist, message explanations and daily briefing. Check the supported categories and coins before subscribing; every Research page is not a separate alert category.
Check the alert list · View alert plans
Inspect the data before choosing a pack.
Prepared research packs supply scoped features, separate outcomes where available and quality flags. Buy a fixed edition once and download directly; API use is optional.
Check data pack samples · Explore the full data catalog · Compare data plans
Each purchased pack includes its specified fields and published date range. This page's full dataset is not automatically included. Other data families require coverage, date, field and source-use confirmation before purchase. Telegram Pro is a separate 30-day service; historical packs are one-time purchases.
Frequently asked questions
Does buying Bitcoin in Extreme Fear work?
Extreme Fear is better treated as an accumulation-review zone than an exact entry. Across 679 complete Extreme Fear days, the next-30-day median was +1.9%; but first-entry days had only a +0.2% median and 55/109 (50.5%) positive outcomes. It did not identify a dependable bottom.
Should I sell Bitcoin in Extreme Greed?
Not automatically. Across all 330 complete Extreme Greed days, the next-30-day median was still +3.8%. Greed can persist during a rising market; use it to review concentration and a prewritten exit plan rather than treating it as a mandatory full sale.
What Fear & Greed levels did you use?
The fixed analysis ranges are 0–24 Extreme Fear, 25–44 Fear, 45–55 Neutral, 56–74 Greed and 75–100 Extreme Greed. Portfolio changes execute at the following UTC daily open.
Did DCA beat lump sum?
The 12-part schedule had a lower one-year median return, +29.8% versus +46.7% for immediate holding, but a shallower median drawdown and more positive cohorts. It beat holding in 36/92 (39.1%).
Are the 92 starts independent?
No. They are monthly rolling starts over one Bitcoin history and strongly overlap. The percentages summarize this historical panel; they are not independent-trial confidence or future odds.
Are fees included?
Yes: 0.15% per buy or sell in the main table, with 0.05% and 0.30% rows in the download. Tax, financing, spread jumps and market impact are not included.
Is Alternative.me Fear & Greed a CoinNudge indicator?
No. Alternative.me is the named third-party source. CoinNudge aligns its daily history with Binance BTCUSDT and tests the disclosed portfolio rules.
Can I reproduce the strategy test?
Yes. The frozen inputs, candidate ledger, full account observations, standalone calculation code, protocol and SHA-256 manifest are public from this page.
Sources and verification
- Alternative.me Crypto Fear & Greed IndexDaily source values and required attribution; not a CoinNudge indicator.
- Binance spot Kline documentationOfficial daily OHLC field definitions; not execution records.
- Public discussion: using fear and greed as a buy/sell signalDemand context only; not evidence that the strategy works.
- Frozen evidence manifestFile hashes, sizes and acquisition edition.
Do not turn one historical percentage into an automatic trade.
Check the live market context and supported alerts before making your own decision.
Explore current market context