Beginner budget decision study · By CoinNudge Research · · Guide updated 2026-10-03 · 20 min read
Crypto for beginners: compare a $1,000 BTC, ETH and SOL portfolio
For a beginner comparing a $1,000 crypto portfolio, more coins did not reliably mean a better typical result or smaller losses in this frozen study. Across 54 matched 90-day Binance spot starts, BTC-only had +2.33% median net return and −20.07% median account drawdown; the 60/25/15 BTC/ETH/SOL mix had +1.77% and −22.59%. The mix also had a stronger upside tail, and BTC/ETH narrowly led at 30 days. Start with your deadline and ability to withstand loss, then compare the five preset policies—not a universal best-coin list. The September 26 evidence, overlapping windows and fixed cost assumptions remain unchanged.
Download 270 observations · Open current market
How can a crypto beginner compare $1,000 choices and downside risk?
- Decide first what loss and holding period you can tolerate: median historical account drawdown exceeded 20% over 90 days in the invested BTC-only and three-coin scenarios, and longer horizons had deeper paths.
- Compare BTC-only, BTC/ETH, a small SOL exposure and cash under one budget, entry date, exit date and cost assumption.
- Diversifying coin tickers did not mean diversifying market risk in this sample. Cash reduced exposure but also forewent some rallies; a personal emergency reserve is a separate issue.
Which $1,000 crypto comparison should a beginner make first?

Compare how much money remains and how much path loss you might need to tolerate under the same starting budget—not just which coin had the largest rally. The five preset policies use the same existing $1,000, no borrowing and no later deposits: BTC only, BTC/ETH, BTC/ETH/cash, BTC/ETH/SOL and zero-yield cash.
For the 54 completed 90-day starts, BTC’s median endpoint was $1,023.29 and 10th-percentile endpoint $764.06; the three-coin mix had $1,017.70 and $726.76. P10 is a sample quantile, not a loss floor or prediction. The complete table below adds 30-, 180- and 365-day results with different mature cohorts; compare policies within the same horizon before comparing horizons.
Keep emergency savings and a necessary spending deadline separate from this speculative budget. If the possible loss is unaffordable, a positive sample median does not repair the problem. Study cash is a zero-yield accounting benchmark, not a tested stablecoin, guaranteed custodial balance or an inflation-adjusted investment.
| Same initial budget | Holding window | Complete starts | Median ending account | P10 ending account | Median peak-to-trough drawdown |
|---|---|---|---|---|---|
| BTC only | 30 days | 54 | $1,011.07 | $836.04 | -11.07% |
| 70% BTC / 30% ETH | 30 days | 54 | $1,011.78 | $826.34 | -12.37% |
| 60% BTC / 25% ETH / 15% SOL | 30 days | 54 | $1,008.84 | $804.02 | -12.84% |
| 70% BTC / 20% ETH / 10% cash | 30 days | 54 | $1,011.33 | $843.81 | -10.88% |
| Cash only | 30 days | 54 | $1,000.00 | $1,000.00 | +0.00% |
| BTC only | 90 days | 54 | $1,023.29 | $764.06 | -20.07% |
| 70% BTC / 30% ETH | 90 days | 54 | $1,019.97 | $748.01 | -21.21% |
| 60% BTC / 25% ETH / 15% SOL | 90 days | 54 | $1,017.70 | $726.76 | -22.59% |
| 70% BTC / 20% ETH / 10% cash | 90 days | 54 | $1,017.03 | $777.43 | -18.85% |
| Cash only | 90 days | 54 | $1,000.00 | $1,000.00 | +0.00% |
| BTC only | 180 days | 51 | $1,154.73 | $576.48 | -25.91% |
| 70% BTC / 30% ETH | 180 days | 51 | $1,119.83 | $546.60 | -29.96% |
| 60% BTC / 25% ETH / 15% SOL | 180 days | 51 | $1,085.35 | $523.42 | -29.65% |
| 70% BTC / 20% ETH / 10% cash | 180 days | 51 | $1,126.33 | $598.91 | -26.05% |
| Cash only | 180 days | 51 | $1,000.00 | $1,000.00 | +0.00% |
| BTC only | 365 days | 45 | $1,542.40 | $608.45 | -28.10% |
| 70% BTC / 30% ETH | 365 days | 45 | $1,343.61 | $598.04 | -35.99% |
| 60% BTC / 25% ETH / 15% SOL | 365 days | 45 | $1,249.64 | $547.49 | -38.28% |
| 70% BTC / 20% ETH / 10% cash | 365 days | 45 | $1,318.36 | $640.66 | -31.54% |
| Cash only | 365 days | 45 | $1,000.00 | $1,000.00 | +0.00% |
How much could a beginner’s account fall before the holding period ends?

Account drawdown is the drop from a running peak, not necessarily the loss from the starting $1,000. In this study BTC’s 90-day median drawdown was 20.07%; an illustrative account rising to $1,200 then falling 20% would be $960. A scheduled endpoint gain can therefore coexist with an uncomfortable path.
The four horizons have 54, 54, 51 and 45 completed monthly starts. They overlap and share the same market periods; adding them does not create independent trials. Use the drawdown chart together with ending account amounts, and check the prior-BTC-state and quarterly-start comparisons before treating a median rank as robust.
Write how much of the whole account can remain exposed, when money may be needed and what would trigger a review. The frozen policies do not model a discretionary early sale, exchange failure, loss of keys, stablecoin failure or changing withdrawal rules. If those risks dominate your decision, the price-only table cannot settle it.
What should a first-time crypto buyer verify before placing an order?
Verify budget, asset identity, execution and custody before the first order: separate reserves, compare same-date policy outcomes, check the exact native or wrapped token and withdrawal network, then confirm spread, minimum order and a review rule you can follow. A small test order can check operations; it does not establish investment expectancy.
Fixed-budget DCA deploys money already available, whereas monthly salary investing introduces new cash later and needs another benchmark. This page tests preset buy-and-hold allocations, not either cash-flow timing strategy. Use the linked DCA study only for its stated upfront-budget question.
October 3 improves the reading workflow and interpretation of the existing September 26 study and October 2 explanatory charts; it does not refresh the prices or refit weights. If your coin, deadline, tax or custody arrangement differs, write that mismatch down before applying a result.
Verify: Compare upfront Bitcoin DCA and lump sum · Check shared crypto portfolio downside
Which $1,000 beginner crypto mix performed best across the matched 90-day starts?
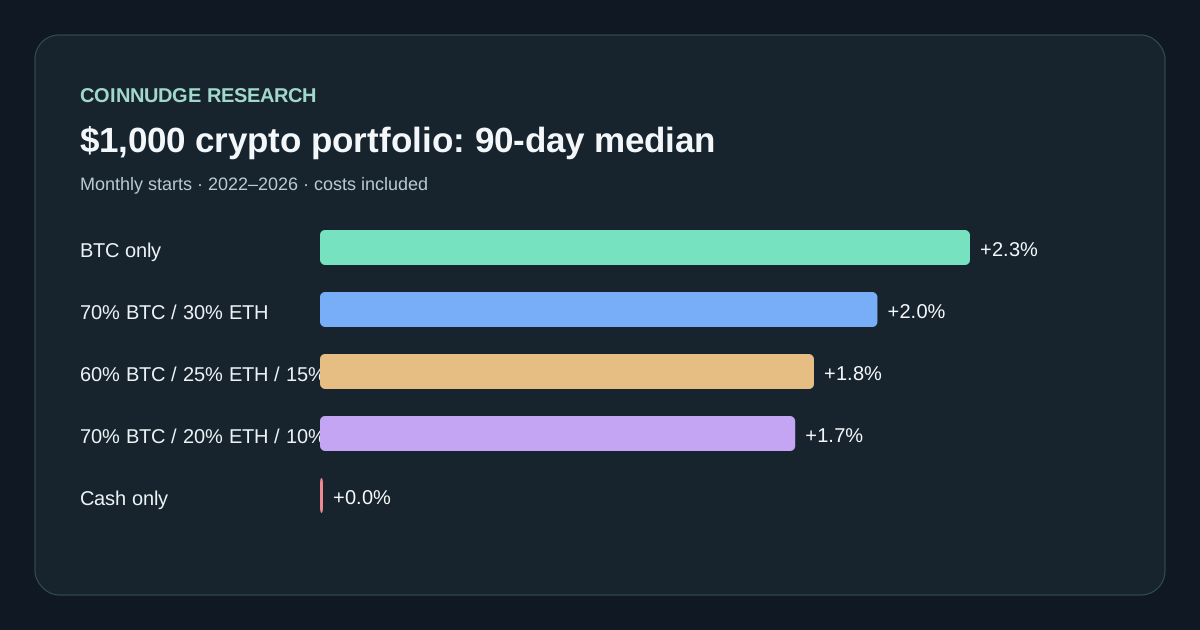
Each strategy starts with exactly $1,000 on the same UTC day. The simple BTC-only policy had the highest median net terminal return among invested examples at +2.33%: $1,023.29 from a $1,000 starting account. The BTC/ETH/SOL mix had a +1.77% median and the deepest median path drawdown, −22.59%. The 70% BTC/20% ETH/10% cash example had +1.70% median return with −18.85% median drawdown. Cash-only remained $1,000 by assumption and is the explicit no-entry comparator, not a claim that fiat is risk-free.
The mixed portfolio's mean (+6.86%) and 90th-percentile (+56.66%) exceeded BTC-only's mean (+6.54%) and 90th-percentile (+47.30%), so an upside-only cherry-pick would tell a different story. Its 10th-percentile result was worse: −27.32% versus BTC-only −23.59%. A beginner deciding by ability to remain invested through a loss should see the lower tail and path, not just the largest winning period.
| Fixed $1,000 policy | 90-day starts | Median net return | 10th-percentile return | Positive outcomes | Median account max drawdown |
|---|---|---|---|---|---|
| BTC only | 54 | +2.33% | −23.59% | 29/54 | −20.07% |
| 70% BTC / 30% ETH | 54 | +2.00% | −25.20% | 29/54 | −21.21% |
| 60% BTC / 25% ETH / 15% SOL | 54 | +1.77% | −27.32% | 28/54 | −22.59% |
| 70% BTC / 20% ETH / 10% cash | 54 | +1.70% | −22.26% | 29/54 | −18.85% |
| Cash only, zero yield | 54 | 0.00% | 0.00% | 0/54 strictly positive | 0.00% |
Verify: 54-start observations CSV · Full results and method JSON
Does the BTC-versus-altcoin comparison change with holding period?
Yes: the 70% BTC/30% ETH policy narrowly led invested median returns at 30 days, while BTC-only’s median exceeded the preset three-coin mix at 90, 180 and 365 days. The fixed weights and 0.20% entry/exit allowances are unchanged across those sensitivity windows.
At 30 days, BTC/ETH was +1.18% median versus BTC +1.11% and the three-coin mix +0.88%. At 365 days, BTC was +54.24% versus the mix +24.96%, but the mix had a higher 90th percentile (+193.84% versus +144.36%) and worse 10th percentile (−45.25% versus −39.16%). These period-sensitive results are not annual returns a beginner should expect.
Compare paths as well: at 365 days median account drawdown was −28.10% for BTC and −38.28% for the mix. Completed starts decline from 54 at 30/90 days to 51 at 180 and 45 at 365; incomplete starts remain pending or missing, not zero. Longer cohorts differ and windows overlap, so the table is sensitivity evidence, not four independent replications or proof that longer is always safer.
| Hold | Complete starts | BTC-only median / 10th pct | BTC/ETH/SOL median / 10th pct | Median account drawdown: BTC / mix |
|---|---|---|---|---|
| 30 days | 54 | +1.11% / −16.40% | +0.88% / −19.60% | −11.07% / −12.84% |
| 90 days | 54 | +2.33% / −23.59% | +1.77% / −27.32% | −20.07% / −22.59% |
| 180 days | 51 | +15.47% / −42.35% | +8.54% / −47.66% | −25.91% / −29.65% |
| 365 days | 45 | +54.24% / −39.16% | +24.96% / −45.25% | −28.10% / −38.28% |
Verify: Four-horizon portfolio results · Every policy, start and horizon · Completed and pending start ledger
How did we compare Bitcoin, Ethereum, Solana and cash fairly?
We froze four invested policies plus cash before computing results. Monthly starts run from January 2022 through June 2026; each holds 90 UTC days without rebalancing. All policies buy at the same day's Binance USDT spot daily open and are valued at the same day-90 open. We require every BTC, ETH and SOL open in each path, so missing data cannot benefit one policy. The three tokens were selected as broad, liquid examples—not as a list of the best coins today.
Each invested tranche pays a 0.20% entry allowance and the marked terminal value includes a 0.20% exit allowance. These are common fee-plus-slippage assumptions, not quotes from a particular venue. Cash earns zero. Account drawdown includes the original $1,000 before entry and every daily mark, so even entry costs count as a decline. Taxes, staking, lending, changing spreads, fixed order minimums and security/custody losses are excluded.
The full daily-open input file retains per-row source labels when present, source-file hashes when available, and observed/ingested times. Some recent archived rows lack an original-file hash, so we do not claim uniform official-file provenance for every bar. These retrospective records are not evidence that CoinNudge observed or could act on the complete dataset at the original time.
| Design choice | Frozen rule | Why it matters |
|---|---|---|
| Starting capital | $1,000 for every policy | No unequal-budget comparison |
| Entry and exit | UTC day 0 and day 90 open | Same market dates and 90-day horizon |
| Trading costs | 0.20% per entry and exit | Net, not frictionless, results |
| Risk path | Initial $1,000 plus 91 daily marked levels | Drawdown includes entry costs and intra-period losses |
| Baseline | Cash-only, zero yield | Makes not investing an explicit alternative |
Verify: Binance Spot Kline field definitions · Public daily-open input rows
Did a rising or falling BTC month change the beginner portfolio result?
The prior-BTC-state comparison did not establish a strong timing rule. Using only the prior 30-day open-to-open move, 28 starts followed an up/flat BTC month and 26 a down month. BTC’s median 90-day net returns were +1.61% and +2.97%; the BTC/ETH/SOL mix’s were +1.77% and +1.73%. Differences are small relative to the wide observed outcome range.
A less-overlapping quarterly-start sensitivity has only 18 observations and changes BTC’s median to −2.48% versus the mix −5.05%. The relative median ordering is similar but the positive monthly median does not survive as a guaranteed level. The same selected assets and broad market eras remain; this is not a separate out-of-sample validation or an independent win probability.
| Prior BTC state | Starts | BTC-only median net | BTC/ETH/SOL median net | Interpretation |
|---|---|---|---|---|
| Prior 30 days up or flat | 28 | +1.61% | +1.77% | Nearly tied; no strong state rule |
| Prior 30 days down | 26 | +2.97% | +1.73% | This past group favored BTC-only |
| Quarterly nonoverlap sensitivity | 18 | −2.48% | −5.05% | Smaller, less-overlapping sample |
Verify: Group and sensitivity outputs
When did adding ETH and SOL help—and when did it hurt?
Adding ETH and SOL helped the three-coin policy’s upside tail and mean in this frozen 90-day sample, but did not improve its median or lower-tail loss. Its 90th-percentile return was +56.66% versus BTC +47.30%; its 10th percentile was −27.32% versus BTC −23.59%. “Never add altcoins” would therefore be as unsupported as “more coins are safer.”
The 10% cash-buffer policy traded some exposure for a lower 90-day median account drawdown (−18.85%) and a lower median return (+1.70%). That pattern is not guaranteed for every start or horizon; cash itself is zero-yield by assumption, and real fiat/stablecoin custody risks are excluded. Decide which risk question matters before picking a favorable column.
| Competing objective | Observed example | Trade-off |
|---|---|---|
| Higher upper-end result | Three-coin mix 90th percentile +56.66% | 10th percentile fell to −27.32% |
| Lower typical path loss | 10% cash buffer median drawdown −18.85% | Median return fell to +1.70% |
| Simpler implementation | BTC-only median +2.33% | Still had −20.07% median max drawdown |
Verify: Full row-level outcomes
How do all five beginner crypto portfolios compare over 30–365 days?
The complete 20-row comparison lets a beginner weigh typical outcome, downside tail, upside tail and path risk together; no single column makes a portfolio universally best. These are all five frozen $1,000 policies at 30, 90, 180 and 365 days, using 54/54/51/45 completed monthly starts respectively. Compare policies within one horizon first: dates match there, while mature cohorts differ across horizons and overlap in time.
Net return includes the fixed entry/exit allowances for invested tranches, and drawdown measures the whole marked account from its running peak. Cash is zero-yield by assumption, not a measured stablecoin return. BTC/ETH narrowly leads the 30-day invested median; the three-coin mix can show stronger upside tails alongside worse downside. A rising median across horizons is not proof that waiting longer causes better returns or eliminates loss. The public outcomes and pending ledger below preserve the sample boundary.
Display-precision note: BTC’s 90-day median drawdown has the same raw value, −0.200650, in both frozen result files. The original table rounds the percentage to −20.07%, while this generated table displays −20.06% because of the binary-floating-point rounding boundary. This 0.01-percentage-point display difference is not a different sample or result; reproduce the calculation from raw JSON, not the rounded cells.
| Hold | Fixed $1,000 policy | Complete starts | Median net return | 10th percentile | 90th percentile | Positive starts | Median account drawdown |
|---|---|---|---|---|---|---|---|
| 30 days | BTC only | 54 | +1.11% | −16.40% | +16.80% | 28/54 | −11.07% |
| 30 days | 70% BTC / 30% ETH | 54 | +1.18% | −17.37% | +20.79% | 30/54 | −12.37% |
| 30 days | 60% BTC / 25% ETH / 15% SOL | 54 | +0.88% | −19.60% | +20.81% | 30/54 | −12.84% |
| 30 days | 70% BTC / 20% ETH / 10% cash | 54 | +1.13% | −15.62% | +17.06% | 29/54 | −10.88% |
| 30 days | Cash only | 54 | +0.00% | +0.00% | +0.00% | 0/54 | +0.00% |
| 90 days | BTC only | 54 | +2.33% | −23.59% | +47.30% | 29/54 | −20.06% |
| 90 days | 70% BTC / 30% ETH | 54 | +2.00% | −25.20% | +47.45% | 29/54 | −21.21% |
| 90 days | 60% BTC / 25% ETH / 15% SOL | 54 | +1.77% | −27.32% | +56.66% | 28/54 | −22.59% |
| 90 days | 70% BTC / 20% ETH / 10% cash | 54 | +1.70% | −22.26% | +39.29% | 29/54 | −18.85% |
| 90 days | Cash only | 54 | +0.00% | +0.00% | +0.00% | 0/54 | +0.00% |
| 180 days | BTC only | 51 | +15.47% | −42.35% | +60.94% | 31/51 | −25.91% |
| 180 days | 70% BTC / 30% ETH | 51 | +11.98% | −45.34% | +58.48% | 30/51 | −29.96% |
| 180 days | 60% BTC / 25% ETH / 15% SOL | 51 | +8.54% | −47.66% | +75.91% | 29/51 | −29.65% |
| 180 days | 70% BTC / 20% ETH / 10% cash | 51 | +12.63% | −40.11% | +51.78% | 31/51 | −26.05% |
| 180 days | Cash only | 51 | +0.00% | +0.00% | +0.00% | 0/51 | +0.00% |
| 365 days | BTC only | 45 | +54.24% | −39.16% | +144.36% | 29/45 | −28.10% |
| 365 days | 70% BTC / 30% ETH | 45 | +34.36% | −40.20% | +123.62% | 28/45 | −35.99% |
| 365 days | 60% BTC / 25% ETH / 15% SOL | 45 | +24.96% | −45.25% | +193.84% | 28/45 | −38.28% |
| 365 days | 70% BTC / 20% ETH / 10% cash | 45 | +31.84% | −35.93% | +115.79% | 29/45 | −31.54% |
| 365 days | Cash only | 45 | +0.00% | +0.00% | +0.00% | 0/45 | +0.00% |
Verify: Every policy and holding-period summary · All completed policy-by-start outcomes · Pending or excluded start ledger
Should a beginner buy BTC, ETH or SOL—or wait?
The study cannot choose a personal allocation, but it can show when the coin-selection question is premature. If a substantial drawdown or a spending deadline makes exposure unaffordable, reducing or delaying exposure deserves attention before selecting the highest historical median.
If you proceed with research, compare coin mechanisms, token rights, total costs and custody, then define invested amount, review date and acceptable loss. A current shortlist answers which assets meet its screen; the BTC/ETH/SOL comparison explains protocol differences; the DCA study compares deployment timing. None converts this preset historical allocation table into a recommendation at today’s price.
Verify: Current coin shortlist · BTC, ETH and SOL comparison · Bitcoin DCA versus lump sum
Does this beginner portfolio study include rebalancing, staking or leverage?
No. Each policy buys at a shared start and holds its purchased units without rebalancing, staking income, borrowing or leverage. The ending percentages can drift as coins move; the policy’s original weights are not continually restored.
If you want monthly rebalancing, interest, staking or leveraged returns, define the new cash flows, costs, restrictions and comparison before testing them. Adding an advertised yield to these endpoints or multiplying the returns by leverage would not reproduce this study. Use these results as a fixed-exposure baseline, not evidence for an untested strategy.
Can these 54 starts predict the best beginner crypto portfolio?
No. The policies use current-survivor major coins and a single exchange's historical spot opens. Early years did not give every future investor the same information about the later survivors. The 54 monthly windows overlap heavily and cross only a few broad market cycles; the 18-quarterly-start check is smaller, not a separate out-of-sample market. Fee assumptions, rebalancing, taxes and time-specific liquidity could change the numbers.
The strongest supported conclusion is narrower: adding ETH and SOL to BTC did not improve median or median drawdown in this specified 90-day sample, while it did enlarge both potential upside and downside tails. That observation should help a beginner ask better risk questions, not be marketed as a fixed allocation rule.
| Evidence layer | Publicly testable | Boundary |
|---|---|---|
| 54 starts × 5 policies | 270 row-level outcomes | Overlapping cohorts |
| Daily research inputs | UTC opens and source hashes | Retrospective local archive with mixed per-row provenance; not at-time CoinNudge observations |
| Exclusions | Missing-date ledger, zero retained exclusions | Does not remove current-survivor selection bias |
| Cost model | 0.20% per side | Not account-specific execution |
Verify: Exclusion ledger · Release manifest and hashes
How can you reproduce the $1,000 portfolio numbers?
Download the complete JSON, 270-row outcomes CSV, exclusion CSV and UTC daily-open input CSV. For each start and policy, allocate $1,000 by frozen weights; purchased units equal tranche × 0.998 divided by the start open. On each day, marked account value is remaining cash plus units × that day's open × 0.998; prepend the original $1,000 and compute peak-to-trough drawdown. End-day net return is value/1,000 − 1. Group the 54 starts by policy and take ordinary medians and 10th percentiles with linear interpolation.
The public inputs contain the selected daily open, quote turnover, source SHA-256 and capture times; the release manifest hashes the published evidence. This deterministic recipe is deliberately independent of the site's display rounding. The generated chart uses the same group JSON, and every table value is rounded from the recorded results rather than reverse-engineered from the graphic.
Verify: Complete result JSON · Outcomes CSV · Daily input CSV
Take the next step with this evidence.
Choose ongoing Telegram monitoring or inspect structured data in your own research workflow.
Receive qualifying events in Telegram.
Use the ready-made alert checklist, message explanations and daily briefing. Check the supported categories and coins before subscribing; every Research page is not a separate alert category.
Check the alert list · View alert plans
Inspect the data before choosing a pack.
Prepared research packs supply scoped features, separate outcomes where available and quality flags. Buy a fixed edition once and download directly; API use is optional.
Check data pack samples · Explore the full data catalog · Compare data plans
Each purchased pack includes its specified fields and published date range. This page's full dataset is not automatically included. Other data families require coverage, date, field and source-use confirmation before purchase. Telegram Pro is a separate 30-day service; historical packs are one-time purchases.
Frequently asked questions
What is the best crypto for a beginner with $1,000?
No single coin is best for every investor. In this 54-start 90-day historical comparison BTC-only had the highest invested-policy median net return, +2.33%, but also a −20.07% median account drawdown. Your ability to absorb loss matters more than one historical rank.
Is BTC safer than a BTC/ETH/SOL beginner portfolio?
In this specific sample BTC-only had a less negative median drawdown and 10th-percentile return than the fixed three-coin mix. That is descriptive, not a guarantee BTC is safe or will outperform next.
Would $1,000 in crypto have made money in every 90-day period?
No. BTC-only was positive in 29 of 54 matched starts; the three-coin mix was positive in 28 of 54. Starts overlap, so these fractions are not independent success probabilities.
Does holding cash lower crypto risk?
In our zero-yield 10% cash-buffer scenario median account drawdown was −18.85%, lower than fully invested examples, while median terminal return was also lower. Real cash or stablecoin has separate risks omitted here.
Does this test DCA or monthly investing?
No. It compares five fixed exposures bought at a common start and sold at day 90. The separate Bitcoin DCA versus lump-sum study compares different deployment timings.
Are the results live buying recommendations?
No. They are retrospective Binance spot scenarios with a fixed cost assumption, selected major coins and overlapping 2022–2026 monthly starts.
Does the beginner BTC-versus-altcoin result change with holding period?
The 70% BTC/30% ETH example narrowly led invested median returns over 30 days. BTC-only's observed median exceeded the 60/25/15 BTC/ETH/SOL mix over 90, 180 and 365 days, with different numbers of completed starts at longer horizons. None is a forecast.
Can I compare all five $1,000 crypto policies across every holding period?
Yes. A 20-row table shows all five fixed policies at 30, 90, 180 and 365 days, including sample counts, median net return, 10th and 90th percentiles, positive starts and median account drawdown. The horizons overlap and longer horizons have fewer completed starts, so the table is not four independent forecasts.
Does a beginner need several cryptocurrencies?
Not necessarily. In the frozen 90-day comparison, the three-coin mixture had a slightly lower median return and deeper median account drawdown than BTC. That comparison does not decide a suitable allocation for you.
Does a 20% drawdown mean losing $200 of my original $1,000?
Not necessarily. Drawdown is measured from the running account peak; terminal gain or loss is measured from original capital. The two charts separate these quantities.
Does the beginner portfolio rebalance every month?
No. Monthly refers to different study start dates. Each preset account keeps its purchased units through its own holding window, without rebalancing or adding money.
Can I apply these results to a leveraged or staking portfolio?
Not directly. Borrowing, liquidation, staking cash flows, locking restrictions and rebalancing are not modeled. Those features need a separate pre-specified test, costs and comparator.
Sources and verification
- CoinNudge $1,000 study JSONFrozen policy, 54-start groups, exclusions and calculation hashes.
- Complete observations CSV270 policy-by-start outcome rows.
- Four-horizon sensitivity evidence30/90/180/365-day groups, observations and incomplete-horizon ledger.
- Dated daily-open inputBinance USDT open, volume, source and capture fields.
- Binance Spot market-data docsOfficial daily Kline field meanings.
- October 2 explanatory evidence editionOriginal experiments preserved; normalized accounting, snapshots and new-study input hashes.
- October 2 readable chart editionChart file hashes and bindings to unchanged frozen numerical evidence.
- Independent October 2 arithmetic auditSeparate arithmetic, checksums and replay diagnostics; not certification of future results.
Check what the market is doing now.
The 54 historical starts cannot choose your next entry. Use live breadth, volume and liquidity with the same risk questions in mind.
Explore Market radar