Historical volume/price event study · By CoinNudge Research · · Guide updated 2026-10-03 · 13 min read
Why can crypto volume spike without the price moving?
A crypto volume spike without a price move does not, by itself, prove accumulation or an imminent breakout. In a frozen one-year study of BTC, ETH, SOL, BNB, XRP and DOGE Binance USDT spot candles, 905 cooldown-separated high-volume/flat-price events met a fixed rule; 901 had a complete next-24-hour path. Their median 24h close return was only +0.085%, with 465/901 (51.6%) positive. A UTC-week cluster bootstrap interval for the median ran from −0.155% to +0.272%, crossing zero. Buy-leaning taker flow offered a useful descriptive split, but sell-leaning events also sometimes rose. Treat this pattern as a question to investigate, not a buy signal.
Inspect live volume spikes · Read the full 905-event ledger
What a high-volume, flat crypto candle can and cannot tell you
- Among 901 mature events, the next-24h median was +0.085% and 51.6% ended higher; the weekly-cluster median interval included zero.
- The immediate next hour had a −0.003% median. A flat high-volume candle is not the same as an immediate breakout.
- Buy-leaning active flow showed a +0.182% median at 24h in 174 events, but sell-leaning flow also showed +0.117% in 247. Taker flow alone did not separate outcomes cleanly.
- Across six pairs the 24h median ranged from SOL −0.215% to BNB +0.266%; the pooled number hides real cross-asset differences.
Why is crypto volume high while the price stays flat?
Volume reports executed trading, not net new demand. Buyers and sellers can exchange large amounts near the same prices; passive resting liquidity may absorb aggressive orders, or activity may rotate within a range. Hourly candles alone cannot identify who supplied the other side, whether displayed orders were canceled or whether the pattern reflects accumulation, distribution or market making.
We tested a measurable version of the user's question rather than assigning motives: an hourly quote-volume ratio of at least 2× the median of the preceding 24 complete hours while the candle's absolute close/open change was at most 0.25%. The comparison used six predeclared Binance USDT spot pairs for the identical historical year, not an all-market sample.
| Fixed event rule | Threshold / timing | Why it matters |
|---|---|---|
| Relative quote volume | At least 2.0× prior 24h median, excluding current hour | Uses only preceding turnover as the baseline |
| Flat price candle | Absolute 1h close/open change ≤0.25% | Keeps the question focused on volume without a simultaneous large candle |
| Repeat-event spacing | First event, then 24h cooldown per symbol | Reduces overlapping event windows |
| Forward outcomes | 1h, 4h and 24h after event close | No incomplete horizon is filled with zero |
Verify: Frozen event definition and exclusions · Binance official K-line fields
What happened after a crypto volume spike with little price movement?
In this frozen six-pair study, a volume spike with a flat candle did not establish a stable positive next-day return. The one-hour median after 905 retained events was −0.003% and 49.3% closed higher; the four-hour median was +0.024% and 51.4% higher. Among 901 events mature at 24 hours, the median was +0.085% with 465 positives (51.6%). Its UTC-week cluster bootstrap 95% interval was −0.155% to +0.272%, crossing zero.
For context, 23,302 mature flat but non-spiking hourly observations had a −0.011% median next-24h return and 49.7% positive. This is an **unmatched descriptive comparator**: it can include overlapping windows and different market states. The small numerical difference is not a causal effect or tradeable edge. A real trading test would also need fill costs, risk limits and a strictly timed entry/exit plan.
| After event close | High-volume flat events | Median close return | Positive closes | Flat non-spike comparator median |
|---|---|---|---|---|
| Next 1h | 905 complete | −0.003% | 49.3% | +0.001% |
| Next 4h | 905 complete | +0.024% | 51.4% | −0.004% |
| Next 24h | 901 complete; 4 pending | +0.085% | 465/901 · 51.6% | −0.011% |
Verify: Full grouped result and interval · Retained event observations
Did Bitcoin, Ether and other major coins behave the same way?
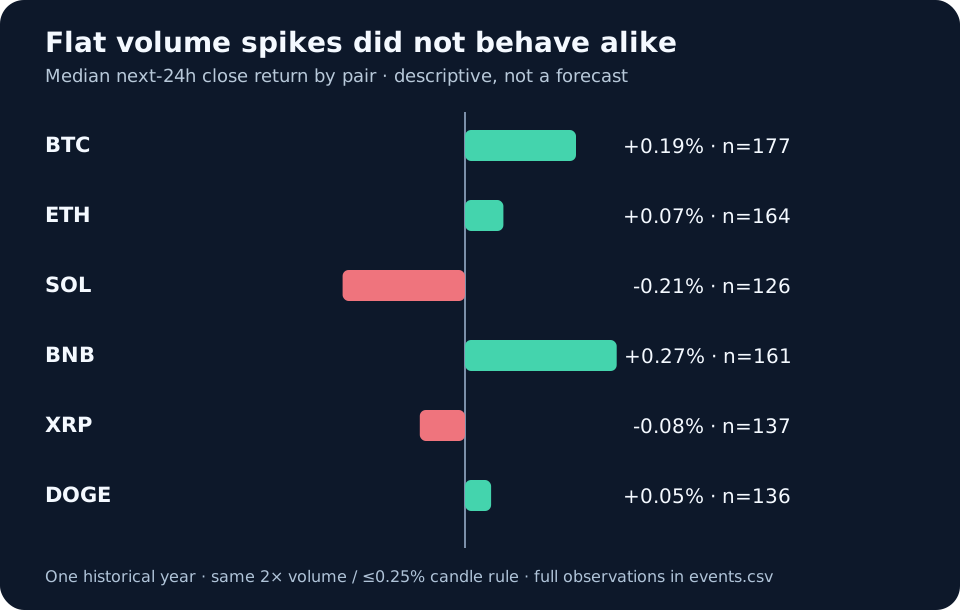
No. BTC had 177 complete 24h events with a +0.195% median; BNB had 161 with +0.266%. SOL's 126 were −0.215% at the median and XRP's 137 were −0.079%. ETH and DOGE were near zero. That spread shows why 'crypto volume spike' is too broad a conclusion without naming the market and its liquidity context.
The six pairs were selected as a fixed, surviving major-coin sample. Delisted coins, new listings and illiquid tokens are not represented; applying these percentages to a thin new coin would be especially unjustified.
| Binance USDT pair | Mature events | 24h median close return | 24h positive outcomes |
|---|---|---|---|
| BTC | 177 | +0.195% | 98/177 · 55.4% |
| ETH | 164 | +0.067% | 84/164 · 51.2% |
| SOL | 126 | −0.215% | 60/126 · 47.6% |
| BNB | 161 | +0.266% | 89/161 · 55.3% |
| XRP | 137 | −0.079% | 66/137 · 48.2% |
| DOGE | 136 | +0.046% | 68/136 · 50.0% |
Verify: Per-pair summaries and counts
Does a positive crypto CVD or active-buy share prove accumulation?
No. We use the K-line's valid taker-buy quote share as a contemporaneous order-flow measure: taker buy quote divided by total quote turnover. It tells us how much executed volume was buyer-initiated, not whether coins moved into wallets or whether a large passive seller was present. All 905 retained events had a valid recorded buy-share field in this release; missing data would be a separate group, never zero sell pressure.
The buy-leaning group (>55% taker-buy share) had 174 complete 24h observations, a +0.182% median and 56.3% positive. The balanced group (45–55%) had 480, a −0.010% median and 49.4% positive. The sell-leaning group (<45%) still had 247, a +0.117% median and 52.6% positive. The pattern is interesting but not a clean classifier; the groups differ by coin and market state and were not matched on those features. We did not measure on-chain accumulation or passive absorption.
| Completed candle's active-buy share | Mature events | Median next 24h | Positive next 24h | What it does not prove |
|---|---|---|---|---|
| >55% buy-leaning | 174 | +0.182% | 56.3% | Future buying or wallet inflow |
| 45–55% balanced | 480 | −0.010% | 49.4% | A neutral future market |
| <45% sell-leaning | 247 | +0.117% | 52.6% | Inevitable continuation lower |
Verify: Order-flow subgroup release · Current CVD and buying/selling pressure methods
Could a flat volume spike still produce a risky 24-hour path?
Yes. Among complete event windows the median maximum favorable excursion from the event close was +1.542%, while the median maximum adverse excursion was −1.609%. These are separate within-window extrema, not returns achieved by one timed trade. The adverse path can matter more than a near-zero ending if a trader uses leverage, a tight stop or a small account.
The per-pair range also varied: SOL's median 24h adverse excursion was about −2.200%, compared with BTC's −1.068%. A historical close-to-close percentage without MAE and MFE would hide that difference. One-hour OHLC does not order highs and lows within the same bar; this study makes no claim about whether a stop or target would have filled first.
| 24h event path measure | Median across mature events | Interpretation |
|---|---|---|
| Final close return | +0.085% | Near zero as a pooled endpoint |
| Maximum favorable excursion | +1.542% | Best intrawindow high relative to event close |
| Maximum adverse excursion | −1.609% | Worst intrawindow low relative to event close |
Verify: Row-level 24h extrema
What should you check when volume jumps but price does not?
First ask whether the volume is unusual for that exact market and hour, not just large in absolute dollars. Then check whether aggressive buying or selling is one-sided, whether order-book depth can absorb a trade of your size, whether the 4h/1d trend agrees, and whether the next completed candle resolves the range. If price stays trapped while volume grows, do not label it a confirmed breakout; if price breaks, check execution costs before acting.
The study does not authorize a simple buy rule. A user who wants to test one should specify an actual entry after the event, stop/exit, position size, costs, skipped orders and non-overlapping outcome windows, then compare against a fair control or an untouched forward sample. CoinNudge's current CVD and market-radar pages are context tools, not a prediction guarantee.
| Decision question | Relevant evidence | Failure case |
|---|---|---|
| Is this really unusual volume? | Prior 24h relative quote-volume baseline | Absolute volume dominated by large coins |
| Who was aggressive? | Valid taker-buy share / CVD | Passive side and wallets remain unknown |
| Did price resolve the range? | Completed 1h/4h closes, higher-timeframe trend | Intrabar wick mistaken for close confirmation |
| Could I trade it? | Bid/ask spread, depth and fees | Gross move smaller than round-trip cost |
Verify: Live crypto volume spikes · Spot buying and selling pressure · Order-book liquidity
How can strong buying coexist with a flat crypto candle?
A large buyer-initiated share can coexist with a flat close because every executed buy has a counterparty and the net price response also depends on liquidity and order placement. It does not identify a whale accumulating inventory or prove that a passive seller was absorbing the flow.
Illustrative arithmetic: if total quote turnover is $10 million and valid taker-buy quote turnover is $6 million, buyer-initiated share is 60%. The signed executed-flow proxy is $6m − $4m = +$2m, not a $2m exchange deposit, wallet inflow or change in market capitalization. This is a field-meaning example, not a newly measured observation.
The unchanged study's >55% group had a +0.182% median next-24h close return, but its <45% group was also positive at +0.117%. That counterexample rules out treating the sign as a sufficient directional classifier. To investigate absorption, add synchronized depth/trade evidence and state its limitations; this hourly-candle pilot did not measure passive counterparties.
Verify: Frozen buy-share subgroup counts and outcomes · Binance K-line quote and taker-buy field definitions
What evidence would separate a watchlist event from a confirmed price move?
A completed break outside a pre-recorded range with acceptable execution conditions is a different observation from the original flat-volume event. Record the event time, range and valid flow first; label any later confirmation as later information, not as an input already known at the volume spike.
If price remains inside the range, keep the interpretation unresolved. If price breaks upward but immediately closes back inside, record the failed continuation rather than revising the event out of the sample. If flow is missing or the intended order cannot be absorbed by current depth, postpone the decision. These are observation branches, not a new tested threshold or a promise that waiting improves returns.
Choose a confirmation interval and invalidation condition before reviewing outcomes, then test its incremental benefit with costs and an untouched period. Do not transplant this six-surviving-major spot study into a taxed new coin or a leveraged perpetual; those add different float, depth, funding and liquidation risks.
Verify: Original frozen event/cooldown/outcome protocol · Breakout confirmation evidence and failed cases · Current execution-depth context
How can this volume-spike experiment be independently checked?
The frozen release includes all six hourly input series, a candidate/exclusion ledger, 905 retained event rows, 23,362 unmatched flat non-spike control rows, group summaries, the fixed method and SHA-256 manifest. A separate verifier reconstructs the event ratio, close/open rule, 1/4/24h returns and 24h high/low path from the frozen input. Four retained events were not mature at 24h and are excluded from the 901 denominator, not assigned zero returns.
This is still a pilot, not a causal absorption test. Its input archive was gathered retrospectively; its six current surviving majors are not an historical all-crypto universe; its comparator is unmatched and has overlapping windows. UTC-week clustered resampling yielded a median 24h interval crossing zero, but clustering does not repair selection bias or transform the study into a live strategy. New market regimes require a new release, not silent rewriting of these numbers.
| Public file | Contains | Audit boundary |
|---|---|---|
| inputs.csv.gz | Frozen 1h OHLC, quote volume, valid taker-buy fields | Retrospective source history |
| candidate-ledger.csv.gz | Retained and 24h-cooldown-excluded high-volume flat candidates | Other non-flat hours are outside the event cohort |
| events.csv / controls.csv.gz | All retained paths and unmatched flat nonspikes | Control difference is descriptive, not causal |
| reproduce.py / manifest.json | Independent event arithmetic and file hashes | Does not verify real fills or actor identity |
Verify: Full result JSON · Independent verifier · Frozen protocol
Take the next step with this evidence.
Choose ongoing Telegram monitoring or inspect structured data in your own research workflow.
Receive qualifying events in Telegram.
Use the ready-made alert checklist, message explanations and daily briefing. Check the supported categories and coins before subscribing; every Research page is not a separate alert category.
Check the alert list · View alert plans
Inspect the data before choosing a pack.
Prepared research packs supply scoped features, separate outcomes where available and quality flags. Buy a fixed edition once and download directly; API use is optional.
Check data pack samples · Explore the full data catalog · Compare data plans
Each purchased pack includes its specified fields and published date range. This page's full dataset is not automatically included. Other data families require coverage, date, field and source-use confirmation before purchase. Telegram Pro is a separate 30-day service; historical packs are one-time purchases.
Frequently asked questions
Does high volume with no price movement mean accumulation?
No. Executed volume and a flat close do not identify the passive counterparty, wallet flows or intentions. In this six-major-pair pilot the next-24h median was +0.085% with an interval crossing zero.
Is a crypto volume spike without a price increase a buy signal?
Not on this evidence alone. Of 901 mature high-volume flat events, 465 (51.6%) closed higher 24h later; path risk, costs and cross-asset differences matter.
Can CVD tell me whether buying was absorbed?
Valid taker-buy share shows aggressive executed flow, not the hidden or resting liquidity that met it. Even sell-leaning events in this sample sometimes rose.
Which coins did the study include?
BTC, ETH, SOL, BNB, XRP and DOGE Binance USDT spot markets, in one common 365-day hourly window. It does not represent all listed or delisted crypto assets.
What happened after one hour versus one day?
The event group's next-1h median was −0.003% and next-24h median +0.085%; neither is a reliable expected trade profit after costs.
Can I reproduce the result?
Yes. Download the frozen hourly inputs, event and control ledgers, protocol and independent verifier. The verifier checks event qualification, return windows and MFE/MAE from published inputs; it cannot identify market participants or future fills.
Sources and verification
- CoinNudge frozen six-market event result905 retained flat-volume events and full grouped outcomes.
- CoinNudge complete hourly inputsRetrospectively archived Binance spot OHLC, quote volume and valid taker-buy quote.
- Binance Spot K-line official fieldsSource field definitions, not an endorsement of CoinNudge conclusions.
Compare volume with actual buying pressure, market breadth and order-book depth on the exact coin you follow.
An alert identifies a condition; it does not decide that a trade has a positive expected return.
Open market radar