Historical decision study · By CoinNudge Research · · Guide updated 2026-10-03 · 28 min read
After an Altcoin Doubles: Hold, Switch to Bitcoin, or Take Cash?
The useful answer is conditional, not simply 'sell after a double.' Across 1,793 complete +100% events in 481 Binance USDT markets, holding for another 90 days returned -25.3% at the median while switching to Bitcoin returned +6.3%; BTC beat holding in 1376/1793 (76.7%). But recent listings and coins already within 10% of their prior high behaved differently: their hold medians were +34.0% and +48.9%. The weak group was mature coins that had doubled from a local low while remaining well below their prior high. A large gain alone is therefore insufficient; market age and recovery structure materially changed the historical outcome.
Preview alert list · Explore research data · See alert plans
Key points
- Main sample: 1,793 complete +100%/90-day events across 481 markets.
- Hold median -25.3%; switch-to-BTC median +6.3%.
- Young listings and recoveries near prior highs were important positive exceptions.
- Equal-market and first-event checks preserved the broad BTC advantage; cluster interval +28.4% to +32.4%.
After an altcoin doubles, did holding, Bitcoin or cash work better?
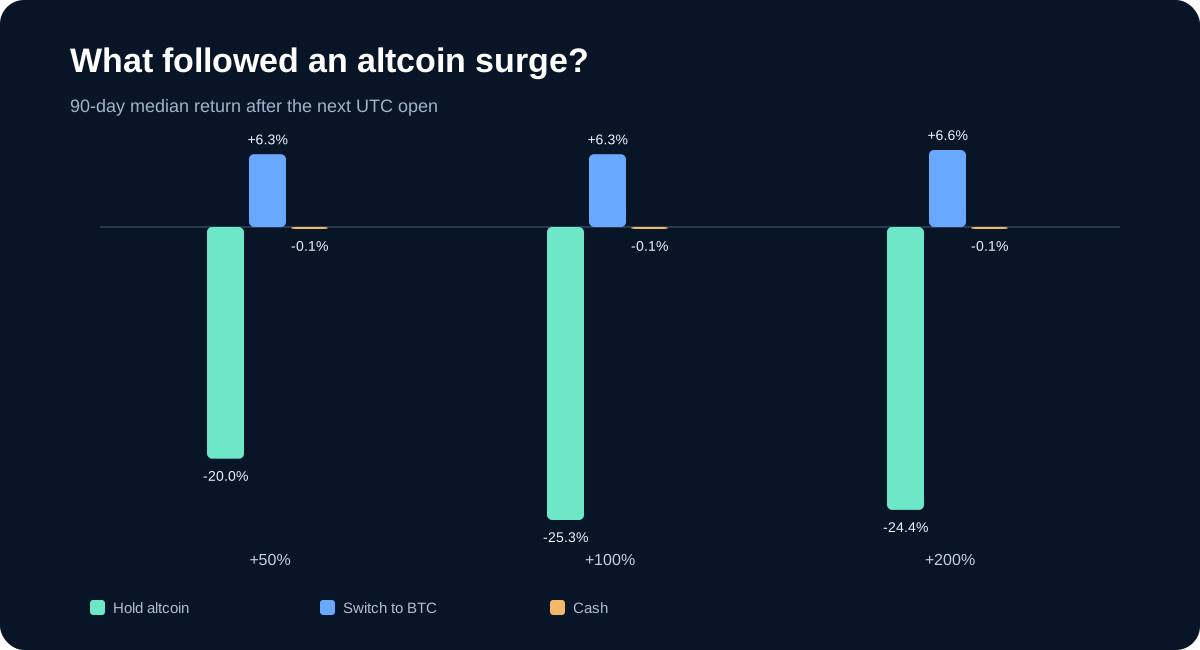
The useful answer is conditional, not simply 'sell after a double.' Across 1,793 complete +100% events in 481 Binance USDT markets, holding for another 90 days returned -25.3% at the median while switching to Bitcoin returned +6.3%; BTC beat holding in 1376/1793 (76.7%). But recent listings and coins already within 10% of their prior high behaved differently: their hold medians were +34.0% and +48.9%. The weak group was mature coins that had doubled from a local low while remaining well below their prior high. A large gain alone is therefore insufficient; market age and recovery structure materially changed the historical outcome.
Only 563/1793 (31.4%) of the held-altcoin outcomes were positive after 90 days, versus 995/1793 (55.5%) after switching to BTC. Relative improvement does not guarantee profit: a BTC switch can still lose even when the original altcoin loses more.
The comparison starts with one unit of existing altcoin value at the decision open. It does not pretend the investor bought at the 90-day low. The earlier profit and personal tax basis are unknown.
| Decision after +100% crossing | Complete events | 90-day median | Positive outcomes | Beat holding |
|---|---|---|---|---|
| Continue holding altcoin | 1,793 | -25.3% | 563/1793 (31.4%) | Baseline |
| Sell and switch to BTC | 1,793 | +6.3% | 995/1793 (55.5%) | 1376/1793 (76.7%) |
| Sell to cash | 1,793 | -0.1% | Capital-preservation reference | 1228/1793 (68.5%) |
Which doubled coins held up—and which ones faded?
Listing age and recovery structure changed the result after a +100% event in this complete 90-day Binance USDT cohort. Under-180-day listings had a +34.0% median holding return versus -28.4% for older markets, and the near-prior-high group had a +48.9% hold median. The table’s individual stratum counts—not the full 1,793-event denominator—apply to each result. Descriptive overlapping partitions do not prove young tokens or breakouts are safer.
These are descriptive partitions, not optimized trading rules. A young coin can still fail, and proximity to a prior high can reflect one exceptional cycle. The strata share events and were not adjusted for token fundamentals, unlocks or delisting risk.
| Condition at signal | Events | Markets | Hold 90d median | Switch to BTC median | BTC beat hold |
|---|---|---|---|---|---|
| Listed <180 days | 278 | 278 | +34.0% | +24.4% | 135/278 (48.6%) |
| Listed ≥180 days | 1,515 | 447 | -28.4% | +3.3% | 1241/1515 (81.9%) |
| Within 10% of prior high | 155 | 139 | +48.9% | +19.7% | 62/155 (40.0%) |
| >10% below prior high | 1,638 | 468 | -26.7% | +5.6% | 1314/1638 (80.2%) |
Did partial profit-taking solve the problem?
A half exit reduced concentration but did not dominate the full BTC switch in the 1,793 complete +100%/90-day observations. Keeping half the altcoin and moving half to cash had a -12.7% median; moving half to BTC had a -9.0% median. The same next-open capital and preset allowances apply to all policies, without assuming the investor bought at the local low.
The path remained volatile: the median held altcoin traded as high as +24.8% above the decision open but also as low as -39.5%. A terminal-only table hides why investors may not stay with the policy.
| Decision | 90-day median | What it changes |
|---|---|---|
| Hold 100% altcoin | -25.3% | Maximum altcoin concentration |
| 50% altcoin / 50% cash | -12.7% | Cuts concentration; cash earns zero |
| 50% altcoin / 50% BTC | -9.0% | Partial market rotation |
| Switch 100% to BTC | +6.3% | Removes altcoin-specific exposure |
What counts as an altcoin doubling?
For every eligible market-day, freeze the minimum closing price from the preceding 90 completed UTC dates. A +100% event occurs only when the current close crosses from below to at least twice that fixed low. Execution waits until the next daily open.
The study requires at least USD 1 million of average quote volume over the prior 30 completed dates and applies a 90-day cooldown per symbol and threshold. These filters reduce illiquid noise and repeated days from the same rally; they do not prove easy execution or independent events.
The +50% and +200% groups were declared as sensitivity checks before results. The page does not rename whichever threshold performed best as the main rule.
| Input | Preset rule | Boundary |
|---|---|---|
| Reference price | Minimum close over prior 90 completed UTC dates | Not an intraday low or investor cost basis |
| Event | First close crossing +50%, +100% or +200% | Next-open decision |
| Liquidity | 30-day mean quote volume ≥ $1m | Historical candles, not guaranteed fill depth |
| Repeat handling | 90-day cooldown per symbol/threshold | Events can still share a market cycle |
Does the answer change after 30, 90 or 180 days?
The pooled hold median was negative across the preset +50%/+100%/+200% thresholds and 30/90/180-day windows, with deeper declines at longer horizons. Each cell has its own complete-case count, not the same 1,793-event main cohort. BTC outcomes also depended on the common Bitcoin path.
That pattern can reflect post-pump reversal, weak assets losing relative strength, the composition of Binance listings and missing failed markets. It is an observed association, not proof that the price surge caused the later decline.
| Initial rise | Horizon | Events / symbols | Hold median | Switch-to-BTC median | BTC beat hold |
|---|---|---|---|---|---|
| +50% | 30d | 3,189 / 539 | -8.2% | +0.7% | 2138/3189 (67.0%) |
| +50% | 90d | 3,121 / 529 | -20.0% | +6.3% | 2415/3121 (77.4%) |
| +50% | 180d | 2,920 / 511 | -37.8% | +10.4% | 2437/2920 (83.5%) |
| +100% | 30d | 1,838 / 489 | -16.6% | -0.8% | 1306/1838 (71.1%) |
| +100% | 90d | 1,793 / 481 | -25.3% | +6.3% | 1376/1793 (76.7%) |
| +100% | 180d | 1,694 / 461 | -43.9% | +6.6% | 1396/1694 (82.4%) |
| +200% | 30d | 727 / 364 | -16.1% | +1.1% | 483/727 (66.4%) |
| +200% | 90d | 711 / 356 | -24.4% | +6.6% | 472/711 (66.4%) |
| +200% | 180d | 662 / 333 | -39.8% | +0.2% | 495/662 (74.8%) |
Which markets contributed most observations?
The table shows up to twenty markets with the most complete +100%/90-day observations. It is an audit of sample composition—not a list of coins to sell. A symbol with many events receives more weight in the pooled median than a symbol with one event.
Medians by symbol can be unstable when n is small. Correlated altcoins and repeated market-wide rallies are not independent replications.
| Market | Events | Hold median | Switch-to-BTC median | BTC beat hold |
|---|---|---|---|---|
| MDTUSDT | 10 | -28.1% | -10.0% | 9/10 (90.0%) |
| CRVUSDT | 9 | -8.7% | -1.3% | 5/9 (55.6%) |
| DUSKUSDT | 9 | -5.9% | -5.7% | 4/9 (44.4%) |
| NEARUSDT | 9 | -16.1% | -2.1% | 5/9 (55.6%) |
| ROSEUSDT | 9 | -31.0% | +13.5% | 7/9 (77.8%) |
| RSRUSDT | 9 | -34.3% | +7.2% | 7/9 (77.8%) |
| AVAXUSDT | 8 | -23.7% | +3.7% | 5/8 (62.5%) |
| BELUSDT | 8 | -47.3% | +0.5% | 6/8 (75.0%) |
| CELRUSDT | 8 | -10.7% | +10.7% | 6/8 (75.0%) |
| CHRUSDT | 8 | -31.5% | +8.9% | 5/8 (62.5%) |
| COSUSDT | 8 | -35.2% | -10.7% | 7/8 (87.5%) |
| FETUSDT | 8 | +31.5% | +22.2% | 3/8 (37.5%) |
| FIDAUSDT | 8 | -47.3% | -8.9% | 7/8 (87.5%) |
| FILUSDT | 8 | -35.9% | +8.4% | 7/8 (87.5%) |
| FLMUSDT | 8 | -22.0% | +17.1% | 7/8 (87.5%) |
| HBARUSDT | 8 | -10.0% | +8.5% | 6/8 (75.0%) |
| INJUSDT | 8 | -3.3% | +8.3% | 6/8 (75.0%) |
| LPTUSDT | 8 | -33.3% | +4.7% | 6/8 (75.0%) |
| RLCUSDT | 8 | -8.0% | +14.8% | 6/8 (75.0%) |
| SNXUSDT | 8 | -28.2% | +2.8% | 7/8 (87.5%) |
Was the result caused by a few repeat-event coins?
Repeated coins did not alone explain the pooled Bitcoin-over-hold result. Keeping only the first complete +100%/90-day event per Binance USDT market left 481 observations: hold median -9.6%, BTC median +15.2%, and BTC ahead in 301/481 (62.6%). The next table distinguishes first-event and equal-market estimands; neither is the full 1,793-event pooled comparison.
Giving every market equal weight produced a median symbol-level hold return of -25.3% and BTC return of +4.8%. The +30.4% paired median is calculated from matched BTC-minus-hold differences, not by subtracting these marginal medians. Its symbol-cluster bootstrap interval was +28.4% to +32.4%, above zero in this edition; common market shocks can still affect many symbols together.
That interval addresses repeated observations within symbols, not common crypto-market shocks across symbols. It should not be read as a causal guarantee.
| Robustness view | Unit | Hold median | BTC median | Paired result |
|---|---|---|---|---|
| All qualifying events | 1,793 events | -25.3% | +6.3% | 1376/1793 (76.7%) BTC ahead |
| First event per market | 481 markets | -9.6% | +15.2% | 301/481 (62.6%) BTC ahead |
| Equal market weight | 481 markets | -25.3% | +4.8% | +30.4% paired median |
What could make this result look too favourable?
Complete-case results omit unavailable or immature endpoints, which can alter the sample and cannot be treated as zero-profit trades. The candidate ledger contains 444 missing-exit, 42 missing-path and 691 immature rows across thresholds and horizons. They are excluded from complete-case medians, not counted as zero.
The frozen product directory excludes classified non-crypto and leveraged products, but it is not a complete point-in-time record of every market that ever disappeared from Binance. Failed or delisted assets can be underrepresented. That survivorship boundary could make holding look better than the unknowable full historical universe—not worse.
The BTC alternative also assumes immediate access and ignores tax consequences. A user may have reasons to scale out, rebalance gradually or hold for a thesis not represented by 90-day candles.
| Candidate status | Rows | Treatment |
|---|---|---|
| Complete | 16,655 | Included |
| Pending | 691 | Preserved, excluded from complete outcomes |
| Missing Exit | 444 | Preserved, excluded from complete outcomes |
| Missing Path | 42 | Preserved, excluded from complete outcomes |
How do you review concentration before taking altcoin profits?
After a large altcoin gain, review concentration before choosing hold, a partial exit, BTC or cash. The experiment begins at a +100% move from a trailing low—not your personal doubling or tax basis—so separate principal, realized gain and tax obligations from its same-next-open comparison.
Check whether the move has broad market support, sustained spot demand and adequate liquidity. A sharp gain with fading volume, weak breadth or leverage-heavy participation deserves a different risk review from a broad spot-led advance.
Do not interpret the pooled median as a live signal for a named coin. Use it as evidence that 'it already doubled, so momentum will continue' is not a safe default assumption.
Verify: When to take crypto profits · Buy after a pump or wait · Current market radar
Data, exclusions and reproducibility
The frozen input contains 590 classified target markets with different listing dates and coverage. Version 2.0 publishes 16,655 complete observations, partial-exit outcomes, path MFE/MAE, first-event and equal-market robustness, structural strata and a market-cluster interval.
The public observation CSV contains every complete row used in the tables. The candidate CSV preserves pending or missing rows instead of turning them into zero returns. JSON includes the frozen contract, summaries and all observations. The standalone Python program rebuilds all three studies from the named frozen inputs.
Rolling observations overlap and share the same market cycles; counts are not independent trials. Historical percentages are descriptive, not probabilities for the next trade. The SHA-256 manifest protects this edition from accidental file changes; it does not remove selection, venue or execution limitations.
Verify: Complete study JSON · Observation CSV · Summary CSV · Candidate and missing ledger · Reproduction program · Preset protocol · File hashes
Take the next step with this evidence.
Choose ongoing Telegram monitoring or inspect structured data in your own research workflow.
Receive qualifying events in Telegram.
Use the ready-made alert checklist, message explanations and daily briefing. Check the supported categories and coins before subscribing; every Research page is not a separate alert category.
Check the alert list · View alert plans
Inspect the data before choosing a pack.
Prepared research packs supply scoped features, separate outcomes where available and quality flags. Buy a fixed edition once and download directly; API use is optional.
Check data pack samples · Explore the full data catalog · Compare data plans
Each purchased pack includes its specified fields and published date range. This page's full dataset is not automatically included. Other data families require coverage, date, field and source-use confirmation before purchase. Telegram Pro is a separate 30-day service; historical packs are one-time purchases.
Frequently asked questions
What should I do after an altcoin doubles?
The useful answer is conditional, not simply 'sell after a double.' Across 1,793 complete +100% events in 481 Binance USDT markets, holding for another 90 days returned -25.3% at the median while switching to Bitcoin returned +6.3%; BTC beat holding in 1376/1793 (76.7%). But recent listings and coins already within 10% of their prior high behaved differently: their hold medians were +34.0% and +48.9%. The weak group was mature coins that had doubled from a local low while remaining well below their prior high. A large gain alone is therefore insufficient; market age and recovery structure materially changed the historical outcome.
Did most doubled altcoins keep rising?
No in this complete-case 90-day sample. Holding was positive in 563/1793 (31.4%); the median held-altcoin return was -25.3%.
Was switching to Bitcoin always profitable?
No. Its median was +6.3%, and 995/1793 (55.5%) were positive. It often lost less than the altcoin without guaranteeing a gain.
Does cash mean a zero return?
The cash reference pays the 0.15% altcoin sale allowance and then earns zero, so its modelled return is -0.15%. Tax, inflation and cash yield are excluded.
How did you define a doubling?
A completed close crossed from below to at least 100% above the minimum close of the preceding 90 completed UTC dates, followed by a next-open decision.
Did you include low-liquidity coins?
Events require at least USD 1 million in trailing-30-day average quote volume. That is a historical filter, not proof of executable depth at every size.
Are delisted coins included?
Only where the frozen discovered-market bundle contains the necessary path. Missing exits remain visible, but the directory is not a perfect point-in-time history of every disappeared market.
Did newly listed coins behave the same as older coins?
No in this edition. Under-180-day listings had a +34.0% 90-day hold median versus -28.4% for older markets; this partition is exploratory, not a forecast.
Is this a sell signal for a coin that doubled today?
No. It is a pooled historical study with selection and dependence limits. Current liquidity, token supply, breadth, flows, position size and tax basis still matter.
Sources and verification
- Binance spot Kline documentationOfficial OHLCV field definitions; candles are not personal execution records.
- Binance public-data documentationPublic historical-file and checksum documentation.
- Frozen CoinNudge evidence manifestHashes, byte sizes and edition scope.
Use the result as a decision check—not an automatic order.
Compare current market conditions and supported alerts before making your own decision.
Open Market Radar